
US Dollar Technical Analysis 05.01.2013
US Dollar Technical Analysis– Prices broke support at a rising trend line set from late February to challenge the 10424-28 area marked by the 23.6% Fibonacci retracement and the March 22 close. A break beneath that aims for the 38.2% level at 10330. Trend line support-turned-resistance is now at 10461.
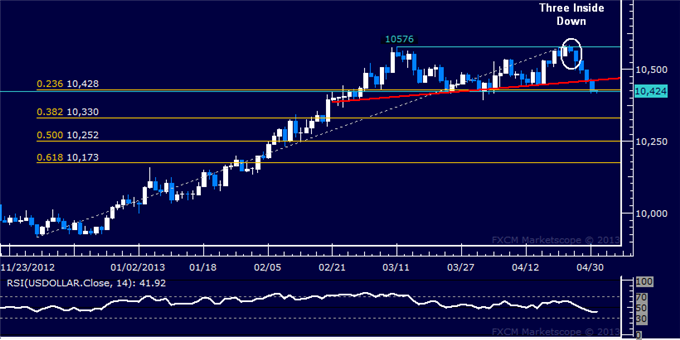
Daily Chart - Created Using FXCM Marketscope 2.0
Want to back-test your technical trading strategy? Download the historical data here.
--- Written by Ilya Spivak, Currency Strategist for Dailyfx.com
To contact Ilya, e-mail ispivak@dailyfx.com. Follow Ilya on Twitter at @IlyaSpivak
To be added to Ilya's e-mail distribution list, please CLICK HERE
New to FX? Watch this Video. For live market updates, visit the Real Time News Feed
DailyFX provides forex news and technical analysis on the trends that influence the global currency markets.
Learn forex trading with a free practice account and trading charts from FXCM.