
Shareholders Should Look Hard At IRC Limited’s (HKG:1029) 0.3% Return On Capital

Today we are going to look at IRC Limited (HKG:1029) to see whether it might be an attractive investment prospect. Specifically, we'll consider its Return On Capital Employed (ROCE), since that will give us an insight into how efficiently the business can generate profits from the capital it requires.
First of all, we'll work out how to calculate ROCE. Second, we'll look at its ROCE compared to similar companies. Last but not least, we'll look at what impact its current liabilities have on its ROCE.
What is Return On Capital Employed (ROCE)?
ROCE measures the 'return' (pre-tax profit) a company generates from capital employed in its business. In general, businesses with a higher ROCE are usually better quality. In brief, it is a useful tool, but it is not without drawbacks. Renowned investment researcher Michael Mauboussin has suggested that a high ROCE can indicate that 'one dollar invested in the company generates value of more than one dollar'.
So, How Do We Calculate ROCE?
The formula for calculating the return on capital employed is:
Return on Capital Employed = Earnings Before Interest and Tax (EBIT) ÷ (Total Assets - Current Liabilities)
Or for IRC:
0.003 = US$1.5m ÷ (US$618m - US$109m) (Based on the trailing twelve months to June 2019.)
So, IRC has an ROCE of 0.3%.
View our latest analysis for IRC
Is IRC's ROCE Good?
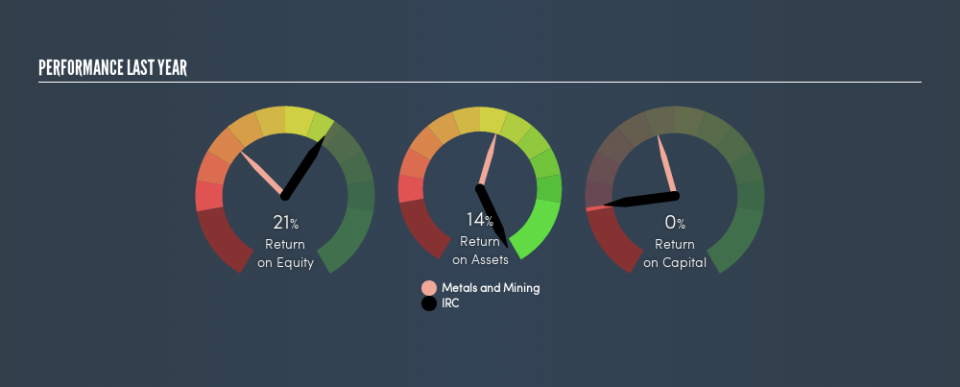
ROCE is commonly used for comparing the performance of similar businesses. We can see IRC's ROCE is meaningfully below the Metals and Mining industry average of 8.4%. This performance is not ideal, as it suggests the company may not be deploying its capital as effectively as some competitors. Independently of how IRC compares to its industry, its ROCE in absolute terms is low; especially compared to the ~2.0% available in government bonds. Readers may wish to look for more rewarding investments.
We can see that , IRC currently has an ROCE of 0.3%, less than the 10% it reported 3 years ago. So investors might consider if it has had issues recently. You can click on the image below to see (in greater detail) how IRC's past growth compares to other companies.
Remember that this metric is backwards looking - it shows what has happened in the past, and does not accurately predict the future. ROCE can be misleading for companies in cyclical industries, with returns looking impressive during the boom times, but very weak during the busts. ROCE is only a point-in-time measure. Given the industry it operates in, IRC could be considered cyclical. Future performance is what matters, and you can see analyst predictions in our free report on analyst forecasts for the company.
IRC's Current Liabilities And Their Impact On Its ROCE
Short term (or current) liabilities, are things like supplier invoices, overdrafts, or tax bills that need to be paid within 12 months. Due to the way the ROCE equation works, having large bills due in the near term can make it look as though a company has less capital employed, and thus a higher ROCE than usual. To counteract this, we check if a company has high current liabilities, relative to its total assets.
IRC has total liabilities of US$109m and total assets of US$618m. Therefore its current liabilities are equivalent to approximately 18% of its total assets. With a very reasonable level of current liabilities, so the impact on ROCE is fairly minimal.
Our Take On IRC's ROCE
While that is good to see, IRC has a low ROCE and does not look attractive in this analysis. Of course, you might also be able to find a better stock than IRC. So you may wish to see this free collection of other companies that have grown earnings strongly.
If you like to buy stocks alongside management, then you might just love this free list of companies. (Hint: insiders have been buying them).
We aim to bring you long-term focused research analysis driven by fundamental data. Note that our analysis may not factor in the latest price-sensitive company announcements or qualitative material.
If you spot an error that warrants correction, please contact the editor at editorial-team@simplywallst.com. This article by Simply Wall St is general in nature. It does not constitute a recommendation to buy or sell any stock, and does not take account of your objectives, or your financial situation. Simply Wall St has no position in the stocks mentioned. Thank you for reading.