
Mountview Estates P.L.C.'s (LON:MTVW) Has Been On A Rise But Financial Prospects Look Weak: Is The Stock Overpriced?
Mountview Estates (LON:MTVW) has had a great run on the share market with its stock up by a significant 19% over the last three months. However, we decided to pay close attention to its weak financials as we are doubtful that the current momentum will keep up, given the scenario. Specifically, we decided to study Mountview Estates' ROE in this article.
Return on equity or ROE is a key measure used to assess how efficiently a company's management is utilizing the company's capital. In simpler terms, it measures the profitability of a company in relation to shareholder's equity.
See our latest analysis for Mountview Estates
How Do You Calculate Return On Equity?
ROE can be calculated by using the formula:
Return on Equity = Net Profit (from continuing operations) ÷ Shareholders' Equity
So, based on the above formula, the ROE for Mountview Estates is:
6.6% = UK£25m ÷ UK£383m (Based on the trailing twelve months to September 2020).
The 'return' is the amount earned after tax over the last twelve months. One way to conceptualize this is that for each £1 of shareholders' capital it has, the company made £0.07 in profit.
What Has ROE Got To Do With Earnings Growth?
We have already established that ROE serves as an efficient profit-generating gauge for a company's future earnings. We now need to evaluate how much profit the company reinvests or "retains" for future growth which then gives us an idea about the growth potential of the company. Assuming all else is equal, companies that have both a higher return on equity and higher profit retention are usually the ones that have a higher growth rate when compared to companies that don't have the same features.
Mountview Estates' Earnings Growth And 6.6% ROE
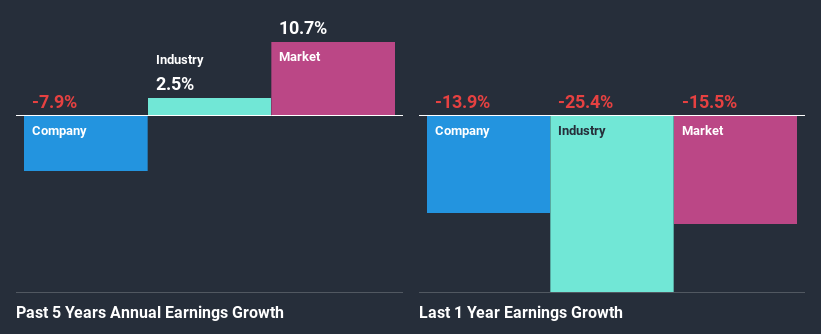
When you first look at it, Mountview Estates' ROE doesn't look that attractive. A quick further study shows that the company's ROE doesn't compare favorably to the industry average of 8.5% either. Given the circumstances, the significant decline in net income by 7.9% seen by Mountview Estates over the last five years is not surprising. However, there could also be other factors causing the earnings to decline. Such as - low earnings retention or poor allocation of capital.
However, when we compared Mountview Estates' growth with the industry we found that while the company's earnings have been shrinking, the industry has seen an earnings growth of 2.5% in the same period. This is quite worrisome.
The basis for attaching value to a company is, to a great extent, tied to its earnings growth. What investors need to determine next is if the expected earnings growth, or the lack of it, is already built into the share price. By doing so, they will have an idea if the stock is headed into clear blue waters or if swampy waters await. Is Mountview Estates fairly valued compared to other companies? These 3 valuation measures might help you decide.
Is Mountview Estates Making Efficient Use Of Its Profits?
With a high three-year median payout ratio of 54% (implying that 46% of the profits are retained), most of Mountview Estates' profits are being paid to shareholders, which explains the company's shrinking earnings. The business is only left with a small pool of capital to reinvest - A vicious cycle that doesn't benefit the company in the long-run.
In addition, Mountview Estates has been paying dividends over a period of at least ten years suggesting that keeping up dividend payments is way more important to the management even if it comes at the cost of business growth.
Summary
On the whole, Mountview Estates' performance is quite a big let-down. As a result of its low ROE and lack of mich reinvestment into the business, the company has seen a disappointing earnings growth rate. Up till now, we've only made a short study of the company's growth data. You can do your own research on Mountview Estates and see how it has performed in the past by looking at this FREE detailed graph of past earnings, revenue and cash flows.
This article by Simply Wall St is general in nature. It does not constitute a recommendation to buy or sell any stock, and does not take account of your objectives, or your financial situation. We aim to bring you long-term focused analysis driven by fundamental data. Note that our analysis may not factor in the latest price-sensitive company announcements or qualitative material. Simply Wall St has no position in any stocks mentioned.
Have feedback on this article? Concerned about the content? Get in touch with us directly. Alternatively, email editorial-team (at) simplywallst.com.