
Here’s What Hinduja Global Solutions Limited’s (NSE:HGS) P/E Ratio Is Telling Us

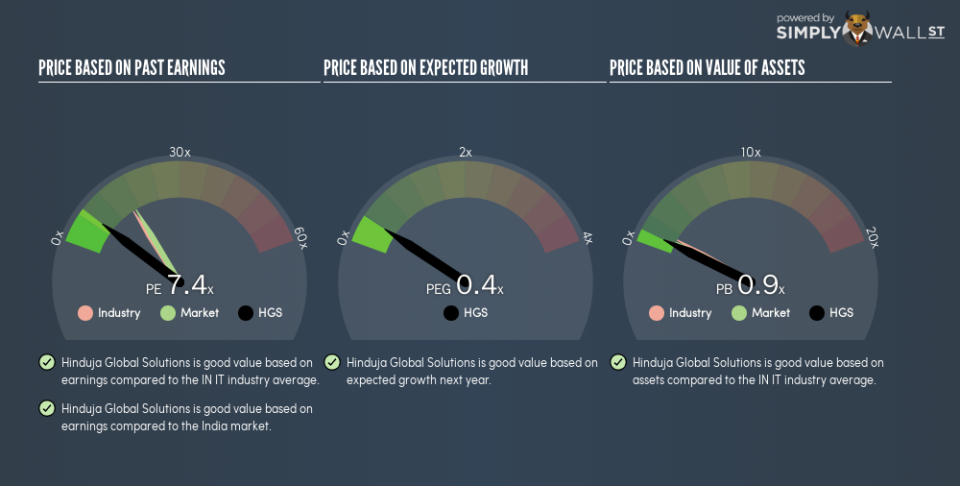
The goal of this article is to teach you how to use price to earnings ratios (P/E ratios). We’ll show how you can use Hinduja Global Solutions Limited’s (NSE:HGS) P/E ratio to inform your assessment of the investment opportunity. Based on the last twelve months, Hinduja Global Solutions’s P/E ratio is 7.38. That is equivalent to an earnings yield of about 14%.
Check out our latest analysis for Hinduja Global Solutions
How Do You Calculate Hinduja Global Solutions’s P/E Ratio?
The formula for price to earnings is:
Price to Earnings Ratio = Share Price ÷ Earnings per Share (EPS)
Or for Hinduja Global Solutions:
P/E of 7.38 = ₹648 ÷ ₹87.83 (Based on the trailing twelve months to September 2018.)
Is A High Price-to-Earnings Ratio Good?
A higher P/E ratio implies that investors pay a higher price for the earning power of the business. That isn’t a good or a bad thing on its own, but a high P/E means that buyers have a higher opinion of the business’s prospects, relative to stocks with a lower P/E.
How Growth Rates Impact P/E Ratios
Earnings growth rates have a big influence on P/E ratios. That’s because companies that grow earnings per share quickly will rapidly increase the ‘E’ in the equation. That means even if the current P/E is high, it will reduce over time if the share price stays flat. Then, a lower P/E should attract more buyers, pushing the share price up.
Hinduja Global Solutions shrunk earnings per share by 1.5% last year. But it has grown its earnings per share by 3.9% per year over the last five years.
How Does Hinduja Global Solutions’s P/E Ratio Compare To Its Peers?
The P/E ratio essentially measures market expectations of a company. We can see in the image below that the average P/E (15.9) for companies in the it industry is higher than Hinduja Global Solutions’s P/E.
Its relatively low P/E ratio indicates that Hinduja Global Solutions shareholders think it will struggle to do as well as other companies in its industry classification. While current expectations are low, the stock could be undervalued if the situation is better than the market assumes. It is arguably worth checking if insiders are buying shares, because that might imply they believe the stock is undervalued.
Remember: P/E Ratios Don’t Consider The Balance Sheet
It’s important to note that the P/E ratio considers the market capitalization, not the enterprise value. In other words, it does not consider any debt or cash that the company may have on the balance sheet. In theory, a company can lower its future P/E ratio by using cash or debt to invest in growth.
Such spending might be good or bad, overall, but the key point here is that you need to look at debt to understand the P/E ratio in context.
Hinduja Global Solutions’s Balance Sheet
The extra options and safety that comes with Hinduja Global Solutions’s ₹2.6b net cash position means that it deserves a higher P/E than it would if it had a lot of net debt.
The Verdict On Hinduja Global Solutions’s P/E Ratio
Hinduja Global Solutions’s P/E is 7.4 which is below average (16.8) in the IN market. The recent drop in earnings per share would almost certainly temper expectations, the relatively strong balance sheet will allow the company time to invest in growth. If it achieves that, then there’s real potential that the low P/E could eventually indicate undervaluation.
When the market is wrong about a stock, it gives savvy investors an opportunity. If it is underestimating a company, investors can make money by buying and holding the shares until the market corrects itself. So this free visualization of the analyst consensus on future earnings could help you make the right decision about whether to buy, sell, or hold.
Of course you might be able to find a better stock than Hinduja Global Solutions. So you may wish to see this free collection of other companies that have grown earnings strongly.
To help readers see past the short term volatility of the financial market, we aim to bring you a long-term focused research analysis purely driven by fundamental data. Note that our analysis does not factor in the latest price-sensitive company announcements.
The author is an independent contributor and at the time of publication had no position in the stocks mentioned. For errors that warrant correction please contact the editor at editorial-team@simplywallst.com.