
Despite Its High P/E Ratio, Is Blue Star Limited (NSE:BLUESTARCO) Still Undervalued?

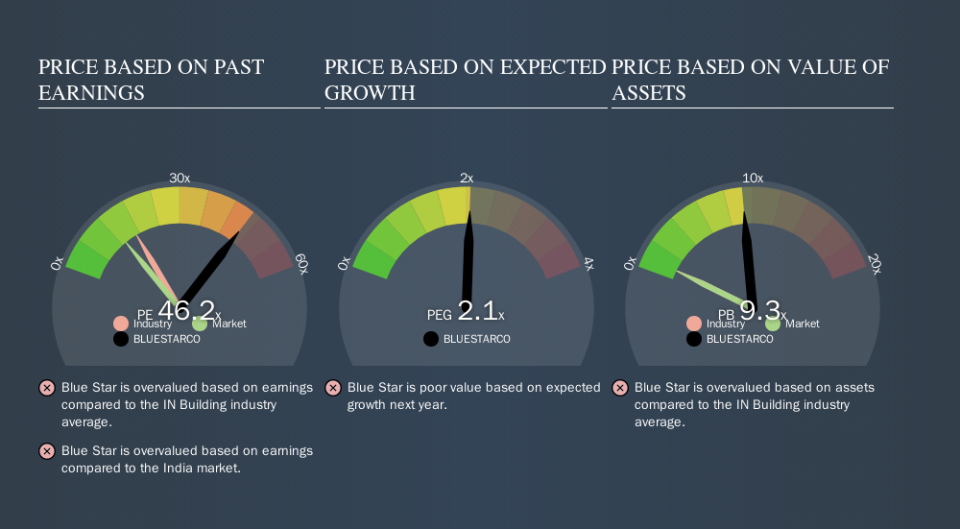
This article is written for those who want to get better at using price to earnings ratios (P/E ratios). We'll look at Blue Star Limited's (NSE:BLUESTARCO) P/E ratio and reflect on what it tells us about the company's share price. Based on the last twelve months, Blue Star's P/E ratio is 46.17. That is equivalent to an earnings yield of about 2.2%.
View our latest analysis for Blue Star
How Do I Calculate Blue Star's Price To Earnings Ratio?
The formula for P/E is:
Price to Earnings Ratio = Share Price ÷ Earnings per Share (EPS)
Or for Blue Star:
P/E of 46.17 = ₹841.05 ÷ ₹18.22 (Based on the trailing twelve months to June 2019.)
Is A High Price-to-Earnings Ratio Good?
A higher P/E ratio means that investors are paying a higher price for each ₹1 of company earnings. That is not a good or a bad thing per se, but a high P/E does imply buyers are optimistic about the future.
How Does Blue Star's P/E Ratio Compare To Its Peers?
The P/E ratio indicates whether the market has higher or lower expectations of a company. You can see in the image below that the average P/E (17.0) for companies in the building industry is lower than Blue Star's P/E.
That means that the market expects Blue Star will outperform other companies in its industry. Clearly the market expects growth, but it isn't guaranteed. So investors should always consider the P/E ratio alongside other factors, such as whether company directors have been buying shares.
How Growth Rates Impact P/E Ratios
P/E ratios primarily reflect market expectations around earnings growth rates. That's because companies that grow earnings per share quickly will rapidly increase the 'E' in the equation. That means even if the current P/E is high, it will reduce over time if the share price stays flat. A lower P/E should indicate the stock is cheap relative to others -- and that may attract buyers.
Blue Star's earnings per share grew by -6.1% in the last twelve months. And earnings per share have improved by 17% annually, over the last five years.
Remember: P/E Ratios Don't Consider The Balance Sheet
It's important to note that the P/E ratio considers the market capitalization, not the enterprise value. That means it doesn't take debt or cash into account. Theoretically, a business can improve its earnings (and produce a lower P/E in the future) by investing in growth. That means taking on debt (or spending its cash).
Such spending might be good or bad, overall, but the key point here is that you need to look at debt to understand the P/E ratio in context.
How Does Blue Star's Debt Impact Its P/E Ratio?
Blue Star has net debt worth just 3.2% of its market capitalization. It would probably trade on a higher P/E ratio if it had a lot of cash, but I doubt it is having a big impact.
The Bottom Line On Blue Star's P/E Ratio
Blue Star has a P/E of 46.2. That's significantly higher than the average in its market, which is 13.2. Given the debt is only modest, and earnings are already moving in the right direction, it's not surprising that the market expects continued improvement.
When the market is wrong about a stock, it gives savvy investors an opportunity. If the reality for a company is better than it expects, you can make money by buying and holding for the long term. So this free visualization of the analyst consensus on future earnings could help you make the right decision about whether to buy, sell, or hold.
But note: Blue Star may not be the best stock to buy. So take a peek at this free list of interesting companies with strong recent earnings growth (and a P/E ratio below 20).
We aim to bring you long-term focused research analysis driven by fundamental data. Note that our analysis may not factor in the latest price-sensitive company announcements or qualitative material.
If you spot an error that warrants correction, please contact the editor at editorial-team@simplywallst.com. This article by Simply Wall St is general in nature. It does not constitute a recommendation to buy or sell any stock, and does not take account of your objectives, or your financial situation. Simply Wall St has no position in the stocks mentioned. Thank you for reading.