
Should You Worry About Embry Holdings Limited’s (HKG:1388) ROCE?

Today we'll evaluate Embry Holdings Limited (HKG:1388) to determine whether it could have potential as an investment idea. Specifically, we're going to calculate its Return On Capital Employed (ROCE), in the hopes of getting some insight into the business.
First up, we'll look at what ROCE is and how we calculate it. Second, we'll look at its ROCE compared to similar companies. Last but not least, we'll look at what impact its current liabilities have on its ROCE.
What is Return On Capital Employed (ROCE)?
ROCE measures the amount of pre-tax profits a company can generate from the capital employed in its business. Generally speaking a higher ROCE is better. Overall, it is a valuable metric that has its flaws. Renowned investment researcher Michael Mauboussin has suggested that a high ROCE can indicate that 'one dollar invested in the company generates value of more than one dollar'.
How Do You Calculate Return On Capital Employed?
The formula for calculating the return on capital employed is:
Return on Capital Employed = Earnings Before Interest and Tax (EBIT) ÷ (Total Assets - Current Liabilities)
Or for Embry Holdings:
0.048 = HK$134m ÷ (HK$3.6b - HK$785m) (Based on the trailing twelve months to June 2019.)
So, Embry Holdings has an ROCE of 4.8%.
See our latest analysis for Embry Holdings
Does Embry Holdings Have A Good ROCE?
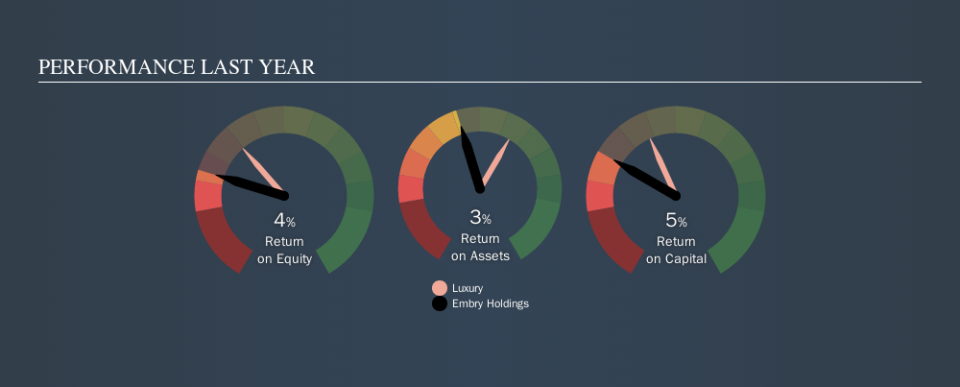
When making comparisons between similar businesses, investors may find ROCE useful. We can see Embry Holdings's ROCE is meaningfully below the Luxury industry average of 9.6%. This could be seen as a negative, as it suggests some competitors may be employing their capital more efficiently. Independently of how Embry Holdings compares to its industry, its ROCE in absolute terms is low; especially compared to the ~2.0% available in government bonds. Readers may wish to look for more rewarding investments.
We can see that, Embry Holdings currently has an ROCE of 4.8%, less than the 9.1% it reported 3 years ago. This makes us wonder if the business is facing new challenges. You can see in the image below how Embry Holdings's ROCE compares to its industry. Click to see more on past growth.
When considering ROCE, bear in mind that it reflects the past and does not necessarily predict the future. ROCE can be deceptive for cyclical businesses, as returns can look incredible in boom times, and terribly low in downturns. ROCE is, after all, simply a snap shot of a single year. If Embry Holdings is cyclical, it could make sense to check out this free graph of past earnings, revenue and cash flow.
How Embry Holdings's Current Liabilities Impact Its ROCE
Current liabilities include invoices, such as supplier payments, short-term debt, or a tax bill, that need to be paid within 12 months. The ROCE equation subtracts current liabilities from capital employed, so a company with a lot of current liabilities appears to have less capital employed, and a higher ROCE than otherwise. To check the impact of this, we calculate if a company has high current liabilities relative to its total assets.
Embry Holdings has total liabilities of HK$785m and total assets of HK$3.6b. As a result, its current liabilities are equal to approximately 22% of its total assets. With a very reasonable level of current liabilities, so the impact on ROCE is fairly minimal.
The Bottom Line On Embry Holdings's ROCE
Embry Holdings has a poor ROCE, and there may be better investment prospects out there. You might be able to find a better investment than Embry Holdings. If you want a selection of possible winners, check out this free list of interesting companies that trade on a P/E below 20 (but have proven they can grow earnings).
I will like Embry Holdings better if I see some big insider buys. While we wait, check out this free list of growing companies with considerable, recent, insider buying.
We aim to bring you long-term focused research analysis driven by fundamental data. Note that our analysis may not factor in the latest price-sensitive company announcements or qualitative material.
If you spot an error that warrants correction, please contact the editor at editorial-team@simplywallst.com. This article by Simply Wall St is general in nature. It does not constitute a recommendation to buy or sell any stock, and does not take account of your objectives, or your financial situation. Simply Wall St has no position in the stocks mentioned. Thank you for reading.