
Should We Worry About China Leon Inspection Holding Limited's (HKG:1586) P/E Ratio?

This article is written for those who want to get better at using price to earnings ratios (P/E ratios). We'll show how you can use China Leon Inspection Holding Limited's (HKG:1586) P/E ratio to inform your assessment of the investment opportunity. China Leon Inspection Holding has a price to earnings ratio of 28.40, based on the last twelve months. That is equivalent to an earnings yield of about 3.5%.
See our latest analysis for China Leon Inspection Holding
How Do You Calculate A P/E Ratio?
The formula for price to earnings is:
Price to Earnings Ratio = Price per Share (in the reporting currency) ÷ Earnings per Share (EPS)
Or for China Leon Inspection Holding:
P/E of 28.40 = HK$1.13 (Note: this is the share price in the reporting currency, namely, CNY ) ÷ HK$0.04 (Based on the trailing twelve months to June 2019.)
Is A High Price-to-Earnings Ratio Good?
The higher the P/E ratio, the higher the price tag of a business, relative to its trailing earnings. That is not a good or a bad thing per se, but a high P/E does imply buyers are optimistic about the future.
Does China Leon Inspection Holding Have A Relatively High Or Low P/E For Its Industry?
The P/E ratio essentially measures market expectations of a company. You can see in the image below that the average P/E (8.7) for companies in the energy services industry is a lot lower than China Leon Inspection Holding's P/E.
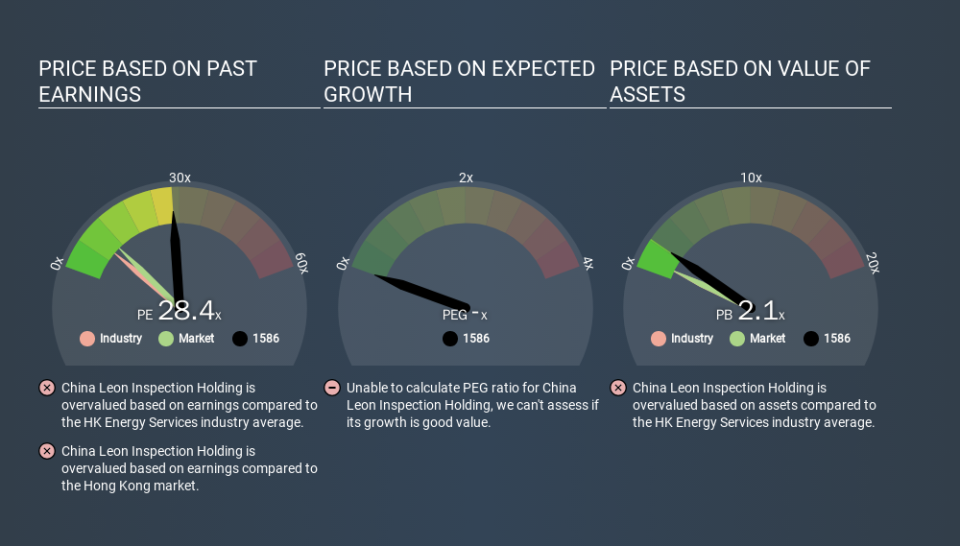
Its relatively high P/E ratio indicates that China Leon Inspection Holding shareholders think it will perform better than other companies in its industry classification. The market is optimistic about the future, but that doesn't guarantee future growth. So investors should delve deeper. I like to check if company insiders have been buying or selling.
How Growth Rates Impact P/E Ratios
When earnings fall, the 'E' decreases, over time. That means unless the share price falls, the P/E will increase in a few years. A higher P/E should indicate the stock is expensive relative to others -- and that may encourage shareholders to sell.
China Leon Inspection Holding's earnings per share fell by 33% in the last twelve months. And over the longer term (3 years) earnings per share have decreased 15% annually. This growth rate might warrant a low P/E ratio.
Remember: P/E Ratios Don't Consider The Balance Sheet
The 'Price' in P/E reflects the market capitalization of the company. That means it doesn't take debt or cash into account. The exact same company would hypothetically deserve a higher P/E ratio if it had a strong balance sheet, than if it had a weak one with lots of debt, because a cashed up company can spend on growth.
Such expenditure might be good or bad, in the long term, but the point here is that the balance sheet is not reflected by this ratio.
Is Debt Impacting China Leon Inspection Holding's P/E?
Since China Leon Inspection Holding holds net cash of CN¥4.7m, it can spend on growth, justifying a higher P/E ratio than otherwise.
The Bottom Line On China Leon Inspection Holding's P/E Ratio
China Leon Inspection Holding's P/E is 28.4 which is above average (10.6) in its market. Falling earnings per share is probably keeping traditional value investors away, but the relatively strong balance sheet will allow the company time to invest in growth. Clearly, the high P/E indicates shareholders think it will!
When the market is wrong about a stock, it gives savvy investors an opportunity. People often underestimate remarkable growth -- so investors can make money when fast growth is not fully appreciated. Although we don't have analyst forecasts you might want to assess this data-rich visualization of earnings, revenue and cash flow.
Of course, you might find a fantastic investment by looking at a few good candidates. So take a peek at this free list of companies with modest (or no) debt, trading on a P/E below 20.
If you spot an error that warrants correction, please contact the editor at editorial-team@simplywallst.com. This article by Simply Wall St is general in nature. It does not constitute a recommendation to buy or sell any stock, and does not take account of your objectives, or your financial situation. Simply Wall St has no position in the stocks mentioned.
We aim to bring you long-term focused research analysis driven by fundamental data. Note that our analysis may not factor in the latest price-sensitive company announcements or qualitative material. Thank you for reading.