
Why We Like Peiport Holdings Ltd.’s (HKG:2885) 13% Return On Capital Employed

Today we'll look at Peiport Holdings Ltd. (HKG:2885) and reflect on its potential as an investment. In particular, we'll consider its Return On Capital Employed (ROCE), as that can give us insight into how profitably the company is able to employ capital in its business.
First of all, we'll work out how to calculate ROCE. Then we'll compare its ROCE to similar companies. Then we'll determine how its current liabilities are affecting its ROCE.
What is Return On Capital Employed (ROCE)?
ROCE measures the amount of pre-tax profits a company can generate from the capital employed in its business. All else being equal, a better business will have a higher ROCE. Ultimately, it is a useful but imperfect metric. Author Edwin Whiting says to be careful when comparing the ROCE of different businesses, since 'No two businesses are exactly alike.
So, How Do We Calculate ROCE?
Analysts use this formula to calculate return on capital employed:
Return on Capital Employed = Earnings Before Interest and Tax (EBIT) ÷ (Total Assets - Current Liabilities)
Or for Peiport Holdings:
0.13 = HK$39m ÷ (HK$331m - HK$26m) (Based on the trailing twelve months to June 2019.)
So, Peiport Holdings has an ROCE of 13%.
Check out our latest analysis for Peiport Holdings
Does Peiport Holdings Have A Good ROCE?
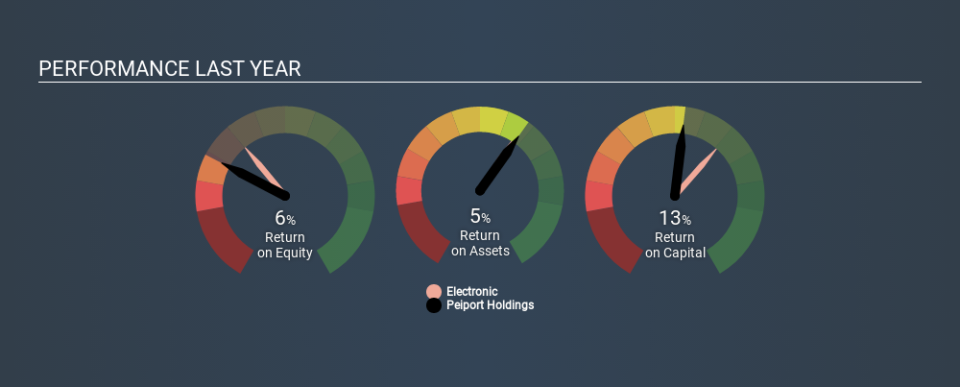
When making comparisons between similar businesses, investors may find ROCE useful. In our analysis, Peiport Holdings's ROCE is meaningfully higher than the 9.9% average in the Electronic industry. I think that's good to see, since it implies the company is better than other companies at making the most of its capital. Independently of how Peiport Holdings compares to its industry, its ROCE in absolute terms appears decent, and the company may be worthy of closer investigation.
The image below shows how Peiport Holdings's ROCE compares to its industry, and you can click it to see more detail on its past growth.
When considering this metric, keep in mind that it is backwards looking, and not necessarily predictive. ROCE can be deceptive for cyclical businesses, as returns can look incredible in boom times, and terribly low in downturns. ROCE is, after all, simply a snap shot of a single year. How cyclical is Peiport Holdings? You can see for yourself by looking at this free graph of past earnings, revenue and cash flow.
How Peiport Holdings's Current Liabilities Impact Its ROCE
Liabilities, such as supplier bills and bank overdrafts, are referred to as current liabilities if they need to be paid within 12 months. Due to the way the ROCE equation works, having large bills due in the near term can make it look as though a company has less capital employed, and thus a higher ROCE than usual. To check the impact of this, we calculate if a company has high current liabilities relative to its total assets.
Peiport Holdings has total liabilities of HK$26m and total assets of HK$331m. Therefore its current liabilities are equivalent to approximately 8.0% of its total assets. In addition to low current liabilities (making a negligible impact on ROCE), Peiport Holdings earns a sound return on capital employed.
What We Can Learn From Peiport Holdings's ROCE
If Peiport Holdings can continue reinvesting in its business, it could be an attractive prospect. Peiport Holdings looks strong on this analysis, but there are plenty of other companies that could be a good opportunity . Here is a free list of companies growing earnings rapidly.
If you like to buy stocks alongside management, then you might just love this free list of companies. (Hint: insiders have been buying them).
If you spot an error that warrants correction, please contact the editor at editorial-team@simplywallst.com. This article by Simply Wall St is general in nature. It does not constitute a recommendation to buy or sell any stock, and does not take account of your objectives, or your financial situation. Simply Wall St has no position in the stocks mentioned.
We aim to bring you long-term focused research analysis driven by fundamental data. Note that our analysis may not factor in the latest price-sensitive company announcements or qualitative material. Thank you for reading.