
Why Overseas Education Limited's (SGX:RQ1) High P/E Ratio Isn't Necessarily A Bad Thing

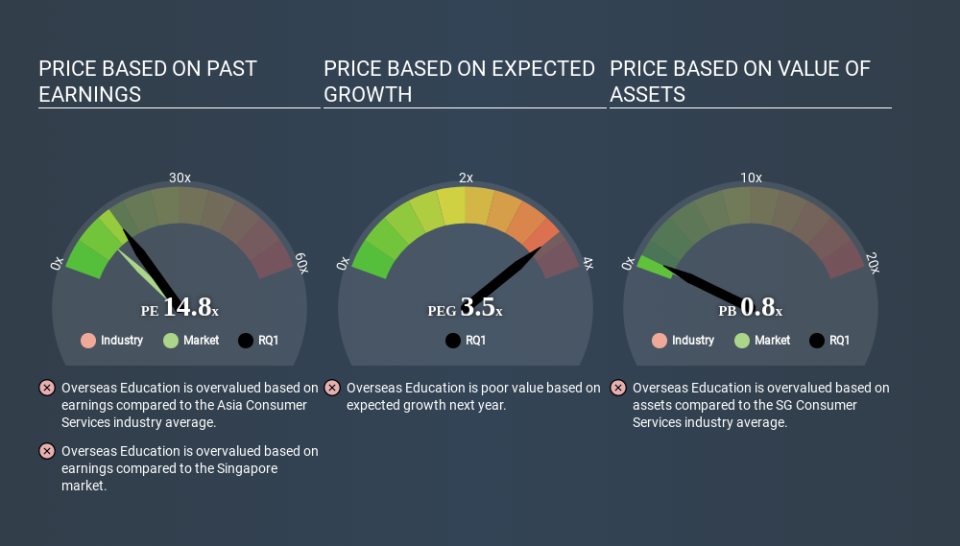
The goal of this article is to teach you how to use price to earnings ratios (P/E ratios). We'll look at Overseas Education Limited's (SGX:RQ1) P/E ratio and reflect on what it tells us about the company's share price. Based on the last twelve months, Overseas Education's P/E ratio is 14.78. That corresponds to an earnings yield of approximately 6.8%.
Check out our latest analysis for Overseas Education
How Do You Calculate A P/E Ratio?
The formula for price to earnings is:
Price to Earnings Ratio = Share Price ÷ Earnings per Share (EPS)
Or for Overseas Education:
P/E of 14.78 = SGD0.285 ÷ SGD0.019 (Based on the year to December 2019.)
(Note: the above calculation results may not be precise due to rounding.)
Is A High Price-to-Earnings Ratio Good?
A higher P/E ratio implies that investors pay a higher price for the earning power of the business. All else being equal, it's better to pay a low price -- but as Warren Buffett said, 'It's far better to buy a wonderful company at a fair price than a fair company at a wonderful price'.
Does Overseas Education Have A Relatively High Or Low P/E For Its Industry?
The P/E ratio indicates whether the market has higher or lower expectations of a company. As you can see below Overseas Education has a P/E ratio that is fairly close for the average for the consumer services industry, which is 14.6.
That indicates that the market expects Overseas Education will perform roughly in line with other companies in its industry. If the company has better than average prospects, then the market might be underestimating it. I would further inform my view by checking insider buying and selling., among other things.
How Growth Rates Impact P/E Ratios
Earnings growth rates have a big influence on P/E ratios. When earnings grow, the 'E' increases, over time. Therefore, even if you pay a high multiple of earnings now, that multiple will become lower in the future. So while a stock may look expensive based on past earnings, it could be cheap based on future earnings.
It's great to see that Overseas Education grew EPS by 16% in the last year. And its annual EPS growth rate over 3 years is 15%. So one might expect an above average P/E ratio. Unfortunately, earnings per share are down 18% a year, over 5 years.
Remember: P/E Ratios Don't Consider The Balance Sheet
One drawback of using a P/E ratio is that it considers market capitalization, but not the balance sheet. So it won't reflect the advantage of cash, or disadvantage of debt. Theoretically, a business can improve its earnings (and produce a lower P/E in the future) by investing in growth. That means taking on debt (or spending its cash).
Spending on growth might be good or bad a few years later, but the point is that the P/E ratio does not account for the option (or lack thereof).
Overseas Education's Balance Sheet
Overseas Education has net debt worth 59% of its market capitalization. If you want to compare its P/E ratio to other companies, you should absolutely keep in mind it has significant borrowings.
The Bottom Line On Overseas Education's P/E Ratio
Overseas Education has a P/E of 14.8. That's higher than the average in its market, which is 10.1. It has already proven it can grow earnings, but the debt levels mean it faces some risks. It seems the market believes growth will continue, judging by the P/E ratio.
When the market is wrong about a stock, it gives savvy investors an opportunity. People often underestimate remarkable growth -- so investors can make money when fast growth is not fully appreciated. So this free visual report on analyst forecasts could hold the key to an excellent investment decision.
Of course you might be able to find a better stock than Overseas Education. So you may wish to see this free collection of other companies that have grown earnings strongly.
If you spot an error that warrants correction, please contact the editor at editorial-team@simplywallst.com. This article by Simply Wall St is general in nature. It does not constitute a recommendation to buy or sell any stock, and does not take account of your objectives, or your financial situation. Simply Wall St has no position in the stocks mentioned.
We aim to bring you long-term focused research analysis driven by fundamental data. Note that our analysis may not factor in the latest price-sensitive company announcements or qualitative material. Thank you for reading.