
Why We’re Not Impressed By Honghua Group Limited’s (HKG:196) 10.0% ROCE
Today we are going to look at Honghua Group Limited (HKG:196) to see whether it might be an attractive investment prospect. To be precise, we'll consider its Return On Capital Employed (ROCE), as that will inform our view of the quality of the business.
First of all, we'll work out how to calculate ROCE. Then we'll compare its ROCE to similar companies. And finally, we'll look at how its current liabilities are impacting its ROCE.
Return On Capital Employed (ROCE): What is it?
ROCE measures the 'return' (pre-tax profit) a company generates from capital employed in its business. In general, businesses with a higher ROCE are usually better quality. Overall, it is a valuable metric that has its flaws. Renowned investment researcher Michael Mauboussin has suggested that a high ROCE can indicate that 'one dollar invested in the company generates value of more than one dollar'.
How Do You Calculate Return On Capital Employed?
Analysts use this formula to calculate return on capital employed:
Return on Capital Employed = Earnings Before Interest and Tax (EBIT) ÷ (Total Assets - Current Liabilities)
Or for Honghua Group:
0.10 = CN¥517m ÷ (CN¥11b - CN¥6.0b) (Based on the trailing twelve months to June 2019.)
So, Honghua Group has an ROCE of 10.0%.
See our latest analysis for Honghua Group
Is Honghua Group's ROCE Good?
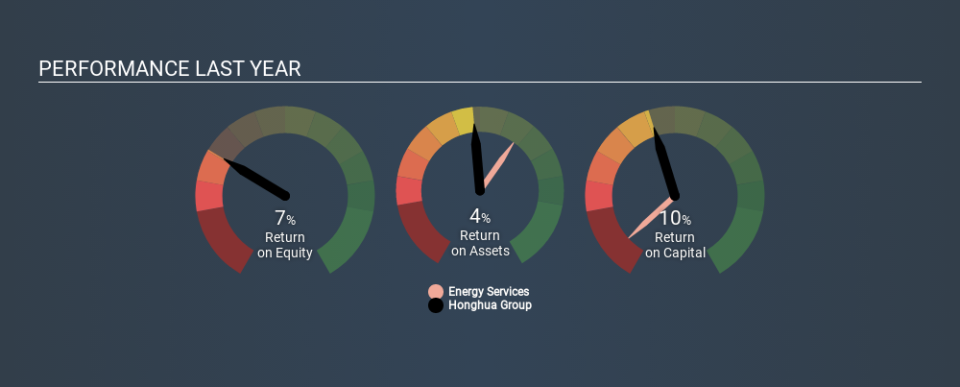
ROCE can be useful when making comparisons, such as between similar companies. Using our data, Honghua Group's ROCE appears to be significantly below the 14% average in the Energy Services industry. This performance could be negative if sustained, as it suggests the business may underperform its industry. Regardless of where Honghua Group sits next to its industry, its ROCE in absolute terms appears satisfactory, and this company could be worth a closer look.
Honghua Group has an ROCE of 10.0%, but it didn't have an ROCE 3 years ago, since it was unprofitable. That implies the business has been improving. The image below shows how Honghua Group's ROCE compares to its industry, and you can click it to see more detail on its past growth.
It is important to remember that ROCE shows past performance, and is not necessarily predictive. ROCE can be deceptive for cyclical businesses, as returns can look incredible in boom times, and terribly low in downturns. This is because ROCE only looks at one year, instead of considering returns across a whole cycle. Remember that most companies like Honghua Group are cyclical businesses. Since the future is so important for investors, you should check out our free report on analyst forecasts for Honghua Group.
What Are Current Liabilities, And How Do They Affect Honghua Group's ROCE?
Current liabilities are short term bills and invoices that need to be paid in 12 months or less. Due to the way the ROCE equation works, having large bills due in the near term can make it look as though a company has less capital employed, and thus a higher ROCE than usual. To counteract this, we check if a company has high current liabilities, relative to its total assets.
Honghua Group has total assets of CN¥11b and current liabilities of CN¥6.0b. Therefore its current liabilities are equivalent to approximately 54% of its total assets. This is admittedly a high level of current liabilities, improving ROCE substantially.
Our Take On Honghua Group's ROCE
This ROCE is pretty good, but remember that it would look less impressive with fewer current liabilities. There might be better investments than Honghua Group out there, but you will have to work hard to find them . These promising businesses with rapidly growing earnings might be right up your alley.
If you are like me, then you will not want to miss this free list of growing companies that insiders are buying.
If you spot an error that warrants correction, please contact the editor at editorial-team@simplywallst.com. This article by Simply Wall St is general in nature. It does not constitute a recommendation to buy or sell any stock, and does not take account of your objectives, or your financial situation. Simply Wall St has no position in the stocks mentioned.
We aim to bring you long-term focused research analysis driven by fundamental data. Note that our analysis may not factor in the latest price-sensitive company announcements or qualitative material. Thank you for reading.