
Why Cathay Pacific Airways Limited’s (HKG:293) Use Of Investor Capital Doesn’t Look Great

Today we are going to look at Cathay Pacific Airways Limited (HKG:293) to see whether it might be an attractive investment prospect. Specifically, we're going to calculate its Return On Capital Employed (ROCE), in the hopes of getting some insight into the business.
First of all, we'll work out how to calculate ROCE. Next, we'll compare it to others in its industry. And finally, we'll look at how its current liabilities are impacting its ROCE.
Return On Capital Employed (ROCE): What is it?
ROCE is a measure of a company's yearly pre-tax profit (its return), relative to the capital employed in the business. In general, businesses with a higher ROCE are usually better quality. In brief, it is a useful tool, but it is not without drawbacks. Author Edwin Whiting says to be careful when comparing the ROCE of different businesses, since 'No two businesses are exactly alike.
So, How Do We Calculate ROCE?
Analysts use this formula to calculate return on capital employed:
Return on Capital Employed = Earnings Before Interest and Tax (EBIT) ÷ (Total Assets - Current Liabilities)
Or for Cathay Pacific Airways:
0.035 = HK$5.4b ÷ (HK$206b - HK$54b) (Based on the trailing twelve months to June 2019.)
Therefore, Cathay Pacific Airways has an ROCE of 3.5%.
Check out our latest analysis for Cathay Pacific Airways
Does Cathay Pacific Airways Have A Good ROCE?
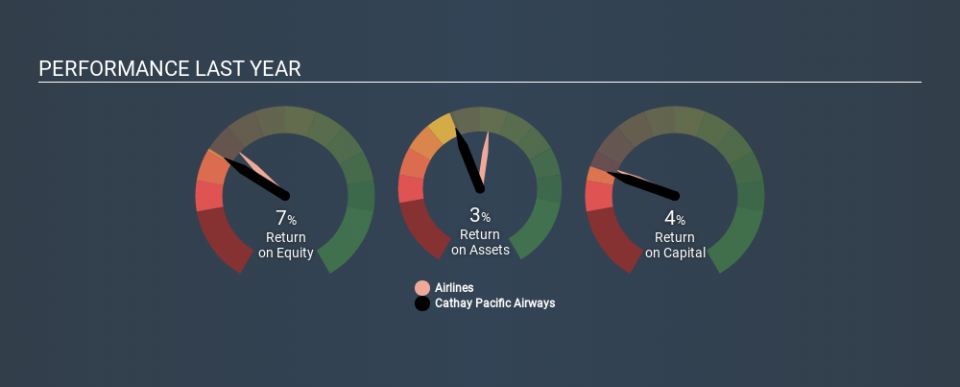
One way to assess ROCE is to compare similar companies. In this analysis, Cathay Pacific Airways's ROCE appears meaningfully below the 7.7% average reported by the Airlines industry. This performance is not ideal, as it suggests the company may not be deploying its capital as effectively as some competitors. Regardless of how Cathay Pacific Airways stacks up against its industry, its ROCE in absolute terms is quite low (especially compared to a bank account). It is likely that there are more attractive prospects out there.
You can see in the image below how Cathay Pacific Airways's ROCE compares to its industry. Click to see more on past growth.
When considering this metric, keep in mind that it is backwards looking, and not necessarily predictive. Companies in cyclical industries can be difficult to understand using ROCE, as returns typically look high during boom times, and low during busts. This is because ROCE only looks at one year, instead of considering returns across a whole cycle. Since the future is so important for investors, you should check out our free report on analyst forecasts for Cathay Pacific Airways.
Cathay Pacific Airways's Current Liabilities And Their Impact On Its ROCE
Current liabilities are short term bills and invoices that need to be paid in 12 months or less. Due to the way ROCE is calculated, a high level of current liabilities makes a company look as though it has less capital employed, and thus can (sometimes unfairly) boost the ROCE. To check the impact of this, we calculate if a company has high current liabilities relative to its total assets.
Cathay Pacific Airways has total assets of HK$206b and current liabilities of HK$54b. As a result, its current liabilities are equal to approximately 26% of its total assets. This is not a high level of current liabilities, which would not boost the ROCE by much.
Our Take On Cathay Pacific Airways's ROCE
While that is good to see, Cathay Pacific Airways has a low ROCE and does not look attractive in this analysis. Of course, you might also be able to find a better stock than Cathay Pacific Airways. So you may wish to see this free collection of other companies that have grown earnings strongly.
If you like to buy stocks alongside management, then you might just love this free list of companies. (Hint: insiders have been buying them).
If you spot an error that warrants correction, please contact the editor at editorial-team@simplywallst.com. This article by Simply Wall St is general in nature. It does not constitute a recommendation to buy or sell any stock, and does not take account of your objectives, or your financial situation. Simply Wall St has no position in the stocks mentioned.
We aim to bring you long-term focused research analysis driven by fundamental data. Note that our analysis may not factor in the latest price-sensitive company announcements or qualitative material. Thank you for reading.