
Wall Street's Telltale Bear Market Warning Is Back With a Vengeance
It's been an incredibly volatile start to the decade for Wall Street, with the ageless Dow Jones Industrial Average (DJINDICES: ^DJI), benchmark S&P 500 (SNPINDEX: ^GSPC), and growth stock-propelled Nasdaq Composite (NASDAQINDEX: ^IXIC) trading off bear and bull markets in successive years.
But it's been nothing short of a green light for the bulls over the last 17 months. Since 2023 kicked off, the Dow Jones, S&P 500, and Nasdaq Composite have respectively gained 20%, 38%, and 60%, with all three indexes pushing to record-closing highs. On the surface, it appears that nothing can slow this red-hot market down.
But looks can be deceiving.

Wall Street's flawless bear market signal is back!
Let me preface this discussion by plainly stating that there's no such thing as a predictive indicator or financial metric that can, with 100% accuracy, guarantee directional moves in the Dow, S&P 500, and Nasdaq Composite. If such a forecasting tool existed, you can rest assured that every professional and retail investor would be using it to gain an edge.
There are, however, select indicators and money-based metrics that have a lengthy history of closely or perfectly correlating with major moves higher or lower in the stock market. One such indicator, which has a flawless track record of forecasting bear markets -- i.e., moves of at least 20% lower in the broad-market indexes -- is back and blaring a clear warning to any investors who'll listen.
This telltale prediction tool is none other than the S&P 500's Shiller price-to-earnings (P/E) ratio, which is also known as the cyclically adjusted price-to-earnings ratio, or CAPE ratio.
Most investors are likely familiar with the traditional P/E ratio, which examines a company's trailing-12-month earnings relative to its share price. The Shiller P/E ratio is based on average inflation-adjusted earnings from the prior 10 years. Using a decade's worth of earnings history smooths out the impact of one-off events, such as the COVID-19 pandemic, to allow investors a clearer picture of valuation trends.
As of the closing bell on May 16 -- a day that saw the Dow Jones Industrial Average briefly eclipse 40,000 for the first time on an intra-day basis -- the S&P 500's Shiller P/E ratio closed at 34.66. This is more than double the average reading of 17.12 for the Shiller P/E when back-tested to 1871.
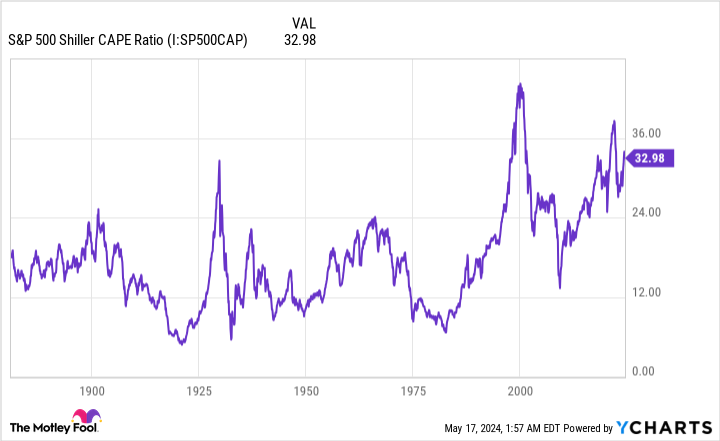
But it's not how far the Shiller P/E ratio is above its historic mean that's worrisome. Rather, it's what's happened over the last 153 years anytime the Shiller P/E surpasses 30 (and stays above this level) during a bull market rally.
Since 1871, there have been only six instances where the Shiller P/E topped 30 during a bull market -- and the previous five cases all resulted in the major stocks indexes eventually tumbling:
Aug. 1929-Sept. 1929: The Shiller P/E first topped 30 just prior to the Great Depression taking shape. The Dow Jones ultimately shed 89% of its value in the following years.
June 1997-Aug. 2001: The highest reading ever for the Shiller P/E (44.19) occurred prior to the dot-com bubble bursting in December 1999. Once the dot-com bubble burst, the S&P 500 lost approximately half of its value, while the Nasdaq Composite was hit even harder.
Sept. 2017-Nov. 2018: The Shiller P/E topped 30, yet again, for more than a year between 2017 and 2018, which led to a 20% pullback in the S&P 500 during the fourth quarter of 2018.
Dec. 2019-Feb. 2020: The Shiller P/E was rapidly climbing just prior to the COVID-19 pandemic. The COVID crash erased 34% from the S&P 500 in 33 calendar days.
Aug. 2020-May 2022: During the first week of January 2022, the Shiller P/E peaked at just over 40. Following this peak, all three stock indexes endured bear market declines, with the Nasdaq losing 33% in 2022.
Nov. 2023-current: As noted, the Shiller P/E is nearing 35, which is its third-highest reading during any individual bull market run.
The caveat to the above is that the Shiller P/E offers no help gauging when downturns in the Dow, S&P 500, and Nasdaq Composite might occur. For instance, the COVID-19 crash was a complete surprise, while valuations during the dot-com bubble remained elevated for more than four years before retracing.
But what the Shiller P/E does clearly show is that elevated valuations can't be sustained over the long run. Although the advent of the internet and historically low interest rates did increase the willingness of investors to take risks, which partially explains the rise in the Shiller P/E we've witnessed since the mid-1990s, a Shiller P/E of almost 35 is a pretty telltale bear market warning to Wall Street and investors.

History is a two-sided and disproportionate coin that favors the patient and optimistic
Considering how strong the bull market rally has been for more than a year, a cautionary tale about a potential bear market probably isn't what investors want to hear. But it's important to have these discussions in order to recognize that history is very much in the corner of optimistic investors with a long-term mindset.
To be perfectly blunt, economic recessions, stock market corrections, and even bear markets are normal and inevitable events. As much as we might dislike the idea of a sea of red temporarily consuming our stock portfolios, or wage growth slowing during an economic contraction, all the wishing in the world won't stop these events from materializing every now and then.
But here's where history comes in handy. Though there have been 12 U.S. recessions since World War II ended in September 1945, only three of these downturns lasted one year. Of the remaining three, none surpassed 18 months in duration.
On the other side of this historical coin, most periods of growth have stuck around for multiple years, including two economic expansions that endured for longer than 10 years. Most public companies in the Dow, S&P 500, and Nasdaq Composite are able to take advantage of long-winded expansions.
This two-sided and disproportionate coin that we call history holds true on Wall Street, as well.
It's official. A new bull market is confirmed.
The S&P 500 is now up 20% from its 10/12/22 closing low. The prior bear market saw the index fall 25.4% over 282 days.
Read more at https://t.co/H4p1RcpfIn. pic.twitter.com/tnRz1wdonp-- Bespoke (@bespokeinvest) June 8, 2023
In June 2023, the researchers at Bespoke Investment Group released a data set that examined every bear and bull market in the S&P 500 dating back to the start of the Great Depression in September 1929. As you can see in the post above from Bespoke on social media platform X, there were 27 separate bear and bull markets.
What's noteworthy is that the average length of S&P 500 bull markets (1,011 calendar days) is about 3.5 times longer than the typical S&P 500 bear market (286 calendar days) over a 94-year stretch. Further, 13 bull markets have lasted longer than the lengthiest bear market since the Great Depression. It absolutely pays to be an optimist on Wall Street.
But it's also vital to look to the horizon. A study from economic research company Crestmont Research analyzed the rolling 20-year total returns, including dividends paid, of the S&P 500 since the start of the 20th century. Even though the S&P didn't come into existence until 1923, researchers were able to back-test to 1900 by tracing the returns of its components in other major indexes prior to its creation.
What Crestmont Research found was that all 105 rolling 20-year periods it examined (1919-2023) produced positive total returns. In plainer English, if you had, hypothetically, purchased an S&P 500 tracking index at any point since 1900 and held for 20 years, you made money. Regardless of what doom and gloom forecast has been thrown Wall Street's way, the S&P 500 has always been higher on a total return basis 20 years later.
Even if history were to repeat itself and valuations contract in a big way in the not-too-distant future, patient investors are likely to benefit from the short-term discounts they'd receive in high-quality stocks.
Where to invest $1,000 right now
When our analyst team has a stock tip, it can pay to listen. After all, the newsletter they have run for over a decade, Motley Fool Stock Advisor, has nearly tripled the market.*
They just revealed what they believe are the 10 best stocks for investors to buy right now…
*Stock Advisor returns as of May 13, 2024
Sean Williams has no position in any of the stocks mentioned. The Motley Fool has no position in any of the stocks mentioned. The Motley Fool has a disclosure policy.
Wall Street's Telltale Bear Market Warning Is Back With a Vengeance was originally published by The Motley Fool