
What Is UTS Marketing Solutions Holdings's (HKG:6113) P/E Ratio After Its Share Price Tanked?

Unfortunately for some shareholders, the UTS Marketing Solutions Holdings (HKG:6113) share price has dived 34% in the last thirty days. Even longer term holders have taken a real hit with the stock declining 19% in the last year.
Assuming nothing else has changed, a lower share price makes a stock more attractive to potential buyers. In the long term, share prices tend to follow earnings per share, but in the short term prices bounce around in response to short term factors (which are not always obvious). The implication here is that long term investors have an opportunity when expectations of a company are too low. Perhaps the simplest way to get a read on investors' expectations of a business is to look at its Price to Earnings Ratio (PE Ratio). A high P/E implies that investors have high expectations of what a company can achieve compared to a company with a low P/E ratio.
See our latest analysis for UTS Marketing Solutions Holdings
Does UTS Marketing Solutions Holdings Have A Relatively High Or Low P/E For Its Industry?
UTS Marketing Solutions Holdings's P/E of 19.72 indicates some degree of optimism towards the stock. You can see in the image below that the average P/E (12.5) for companies in the commercial services industry is lower than UTS Marketing Solutions Holdings's P/E.
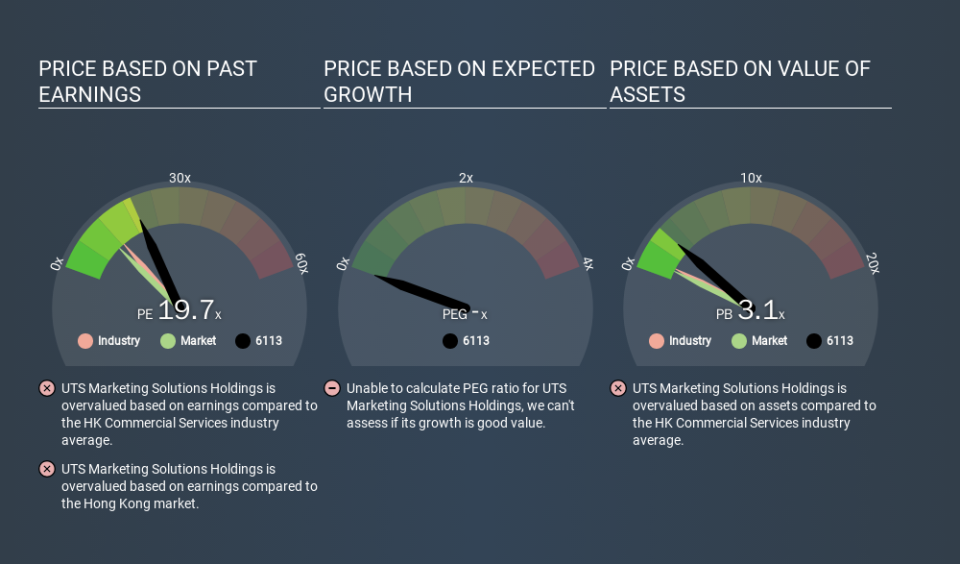
Its relatively high P/E ratio indicates that UTS Marketing Solutions Holdings shareholders think it will perform better than other companies in its industry classification. Clearly the market expects growth, but it isn't guaranteed. So further research is always essential. I often monitor director buying and selling.
How Growth Rates Impact P/E Ratios
Generally speaking the rate of earnings growth has a profound impact on a company's P/E multiple. That's because companies that grow earnings per share quickly will rapidly increase the 'E' in the equation. That means unless the share price increases, the P/E will reduce in a few years. A lower P/E should indicate the stock is cheap relative to others -- and that may attract buyers.
UTS Marketing Solutions Holdings increased earnings per share by a whopping 34% last year. And its annual EPS growth rate over 5 years is 336%. I'd therefore be a little surprised if its P/E ratio was not relatively high.
Remember: P/E Ratios Don't Consider The Balance Sheet
One drawback of using a P/E ratio is that it considers market capitalization, but not the balance sheet. Thus, the metric does not reflect cash or debt held by the company. Theoretically, a business can improve its earnings (and produce a lower P/E in the future) by investing in growth. That means taking on debt (or spending its cash).
While growth expenditure doesn't always pay off, the point is that it is a good option to have; but one that the P/E ratio ignores.
Is Debt Impacting UTS Marketing Solutions Holdings's P/E?
With net cash of RM42m, UTS Marketing Solutions Holdings has a very strong balance sheet, which may be important for its business. Having said that, at 18% of its market capitalization the cash hoard would contribute towards a higher P/E ratio.
The Bottom Line On UTS Marketing Solutions Holdings's P/E Ratio
UTS Marketing Solutions Holdings has a P/E of 19.7. That's higher than the average in its market, which is 10.7. The excess cash it carries is the gravy on top its fast EPS growth. So based on this analysis we'd expect UTS Marketing Solutions Holdings to have a high P/E ratio. What can be absolutely certain is that the market has become significantly less optimistic about UTS Marketing Solutions Holdings over the last month, with the P/E ratio falling from 29.9 back then to 19.7 today. For those who don't like to trade against momentum, that could be a warning sign, but a contrarian investor might want to take a closer look.
When the market is wrong about a stock, it gives savvy investors an opportunity. If the reality for a company is better than it expects, you can make money by buying and holding for the long term. Although we don't have analyst forecasts shareholders might want to examine this detailed historical graph of earnings, revenue and cash flow.
Of course, you might find a fantastic investment by looking at a few good candidates. So take a peek at this free list of companies with modest (or no) debt, trading on a P/E below 20.
If you spot an error that warrants correction, please contact the editor at editorial-team@simplywallst.com. This article by Simply Wall St is general in nature. It does not constitute a recommendation to buy or sell any stock, and does not take account of your objectives, or your financial situation. Simply Wall St has no position in the stocks mentioned.
We aim to bring you long-term focused research analysis driven by fundamental data. Note that our analysis may not factor in the latest price-sensitive company announcements or qualitative material. Thank you for reading.