
US Dollar Trying to Set a Bottom, SPX 500 Stuck in Familiar Territory
Talking Points:
US Dollar Trying to Carve Out a Double Bottom Setup
S&P 500 Remains Locked in a Familiar Trading Range
Gold Chart Setup Favors Resumption of Down Trend
Can’t access to the Dow Jones FXCM US Dollar Index? Try the USD basket on Mirror Trader. **
US DOLLAR TECHNICAL ANALYSIS – Prices are attempting to carve out a double bottom at 10375. Near-term resistance is at 10472, marked by the top of a falling channel that has guided the greenback lower since the beginning of the year. A break above that on a daily closing basis initially targets support-turned-resistance at 10495.
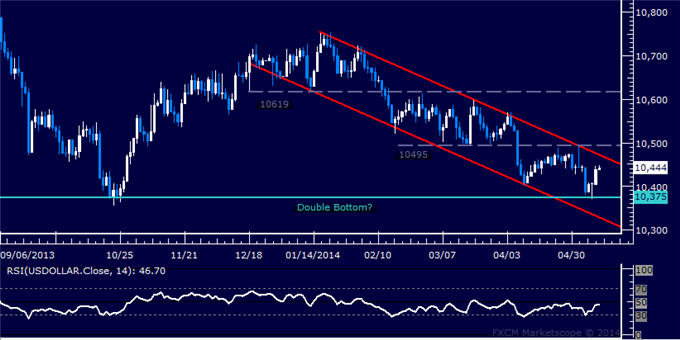
Daily Chart - Created Using FXCM Marketscope 2.0
** The Dow Jones FXCM US Dollar Index and the Mirror Trader USD basket are not the same product.
S&P 500 TECHNICAL ANALYSIS – Prices rebounded as expected after putting in a Piercing Line candlestick pattern. The index is now treading water below the 38.2%Fibonacci expansionat 1880.30. A break upward initially targets the 50%level at 1889.60. Alternatively, a reversal below the 23.6%Fibat 1868.70 exposes the April 28 low at 1850.10.
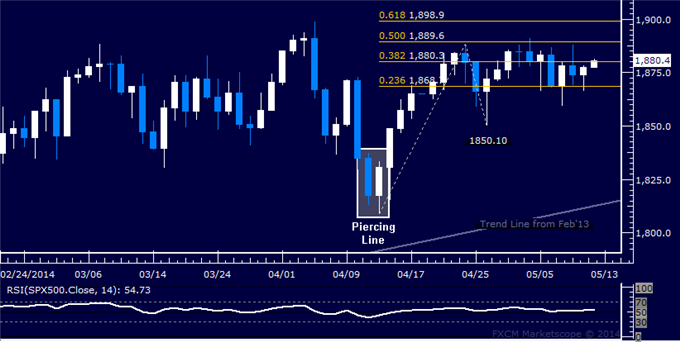
Daily Chart - Created Using FXCM Marketscope 2.0
GOLD TECHNICAL ANALYSIS – Prices are consolidating below resistance in the 1311.49-15.60 area, marked by the top of a descending Triangle chart formation and the 38.2% Fibonacci retracement. A break above that on daily closing basis targets the 50% level at 1330.18. The descending Triangle argues in favor of bearish continuation however (though confirmation is absent for now). Near-term support is at 1277.00, the Triangle bottom, followed by the April 24 low at 1268.40.
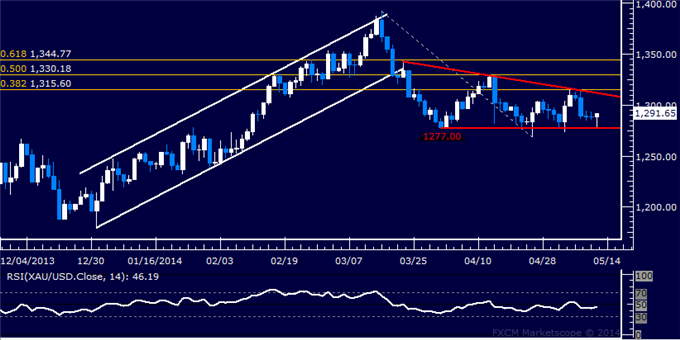
Daily Chart - Created Using FXCM Marketscope 2.0
CRUDE OIL TECHNICAL ANALYSIS – Prices are consolidating near the psychologically significant $100/barrel figure. Breaking below the 23.6% Fibonacci expansion at 99.67 exposes the 38.2% level at 98.76. Alternatively, a bounce above the 38.2% Fib retracement at 101.11 sees the next upside barrier at 101.85.
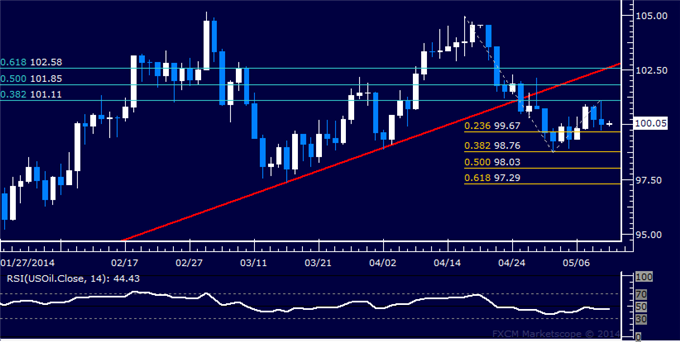
Daily Chart - Created Using FXCM Marketscope 2.0
--- Written by Ilya Spivak, Currency Strategist for DailyFX.com
To receive Ilya's analysis directly via email, please SIGN UP HERE
Contact and follow Ilya on Twitter: @IlyaSpivak
DailyFX provides forex news and technical analysis on the trends that influence the global currency markets.
Learn forex trading with a free practice account and trading charts from FXCM.