
US Dollar Soars as S&P 500 Stalls Below Chart Resistance
THE TAKEAWAY: The US Dollar raced upward to produce what appears to be a meaningful topside breakout while the S&P 500 has stalled at chart resistance, hinting at a pullback.
US DOLLAR TECHNICAL ANALYSIS– Prices broke above resistance at the top of a rising channel set from early March, exposing the 123.6% Fibonacci expansion at 10640. A further push above that targets the 138.2% mark at 10668. The channel top – now at 10590 – has been recast as near-term support.
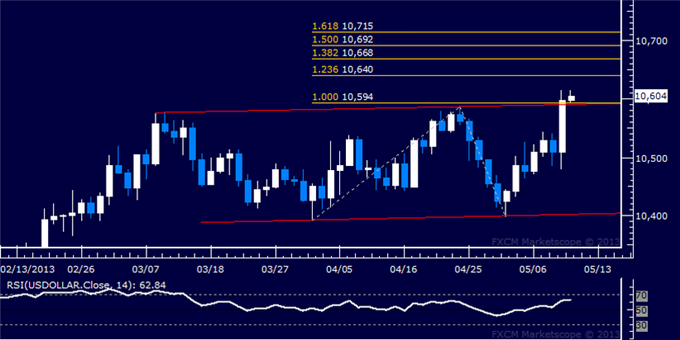
Daily Chart - Created Using FXCM Marketscope 2.0
S&P 500 TECHNICAL ANALYSIS – Prices put in a Harami candlestick pattern below resistance at 1633.20, the 38.2% Fibonacci expansion, hinting a move lower may be ahead. Near-term support is marked by the psychologically significant 1600 figure and the 23.6% level at 1595.90. A break below that initially exposes the 14.6% Fib at 1572.90. Alternatively, a reversal above resistance eyes the 50% expansion at 1663.30.
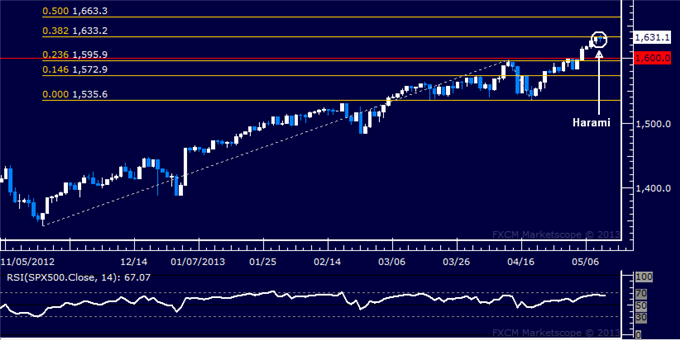
Daily Chart - Created Using FXCM Marketscope 2.0
GOLD TECHNICAL ANALYSIS – Prices continue to consolidate below resistance at 1487.65, the 61.8% Fibonacci expansion. A break above that initially exposes the 76.4% level at 1526.88. Near-term support is at 1448.77, the 14.6% Fib expansion, with a reversal beneath that aiming for the 23.6% mark at 1424.59.
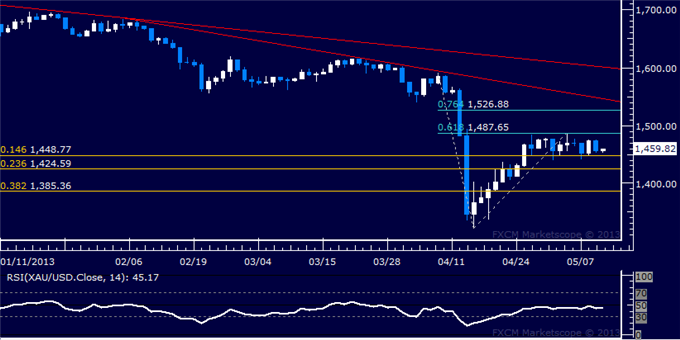
Daily Chart - Created Using FXCM Marketscope 2.0
CRUDE OIL TECHNICAL ANALYSIS– Prices are testing resistance at the 97.00 figure, marked by the 76.4% Fibonacci expansion and a falling trend line set from early January, with a Harami candlestick pattern hinting a turn lower may be ahead. Near-term support is at 94.39, the 23.6% Fib retracement, with a drop beneath that eyeing the 38.2% mark at 92.71. Alternatively, a push above resistance exposes the 100% level at 99.14.
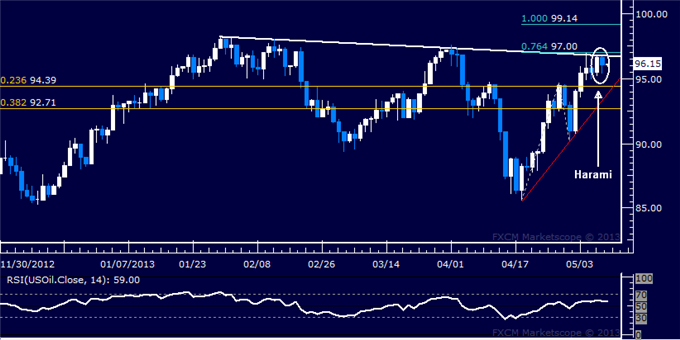
Daily Chart - Created Using FXCM Marketscope 2.0
--- Written by Ilya Spivak, Currency Strategist for Dailyfx.com
To contact Ilya, e-mail ispivak@dailyfx.com. Follow Ilya on Twitter at @IlyaSpivak
To be added to Ilya's e-mail distribution list, please CLICK HERE
New to FX? Watch this Video. For live market updates, visit the Real Time News Feed
DailyFX provides forex news and technical analysis on the trends that influence the global currency markets.
Learn forex trading with a free practice account and trading charts from FXCM.