
US Dollar Falters at Resistance, S&P 500 Hits 5-Week Low
THE TAKEAWAY: The US Dollar declined alongside the S&P 500, recoiling from chart resistance as the benchmark stock index sank to the lowest level in five weeks.
Don’t have access to the Dow Jones FXCM US Dollar Index? Try the USD basket via Mirror Trader as an alternative. **
US DOLLAR TECHNICAL ANALYSIS – Prices recoiled from resistance at 10744, the 38.2% Fibonacci expansion, reversing through the 23.6% level at 10708 to expose the August 8 low at 10650 and falling channel bottom support at 10615. The 10708 mark has been recast as near-term resistance.
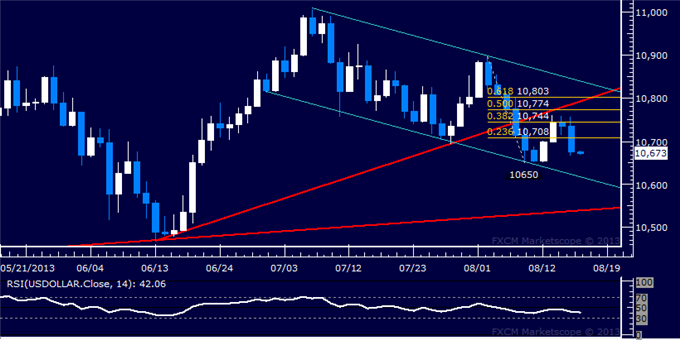
Daily Chart - Created Using FXCM Marketscope 2.0
** The Dow Jones FXCM US Dollar Index and the Mirror Trader USD basket are not the same product.
S&P 500 TECHNICAL ANALYSIS – Prices pulled back as expected after putting in a Hanging Man candlestick and extended lower after clearing support at 1687.40, the May swing high. Sellers now aim to challenge the 38.2% Fibonacci retracement at 1652.10, with a break below that targeting the 50% level 1634.40. Near-term resistance is at 1674.10, the 23.6% Fib, with a move back above that eyeing 1687.40 anew.
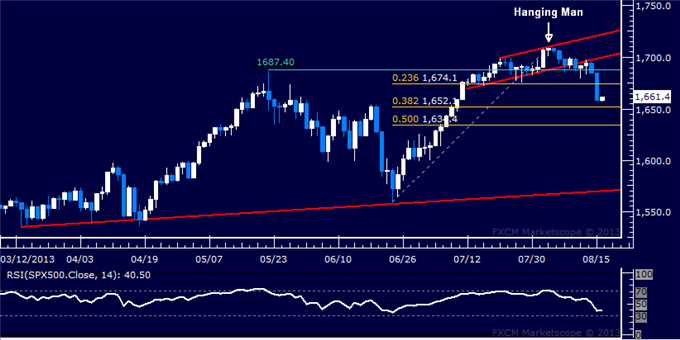
Daily Chart - Created Using FXCM Marketscope 2.0
GOLD TECHNICAL ANALYSIS – Prices continued to push higher after breaking resistance at a falling trend line set from early May. Buyers now aim to challenge the 61.8% Fibonacci expansion at 1376.28, with a break above that targeting the 76.4% level at 1400.72. Near-term support is at 1356.22, the 50% Fib. A reversal back beneath that exposes the 38.2% expansion at 1336.76.
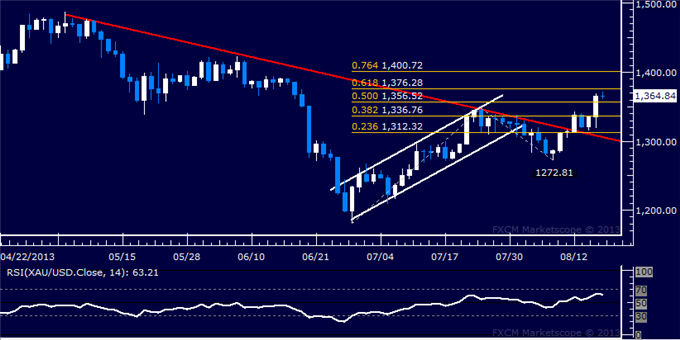
Daily Chart - Created Using FXCM Marketscope 2.0
CRUDE OIL TECHNICAL ANALYSIS– Prices appear to be carving out a Flag chart pattern, indicative of downward correction preceding the resumption of the longer-term uptrend. A push above the 23.6% Fibonacci expansion at 106.04 has exposed the Flag top at the 107.00 figure, with a daily close above that targeting the 38.2% level at 108.40. Alternatively, a move back below 106.04 aims for the August 8 low at 102.21, followed by the Flag bottom at 101.88.
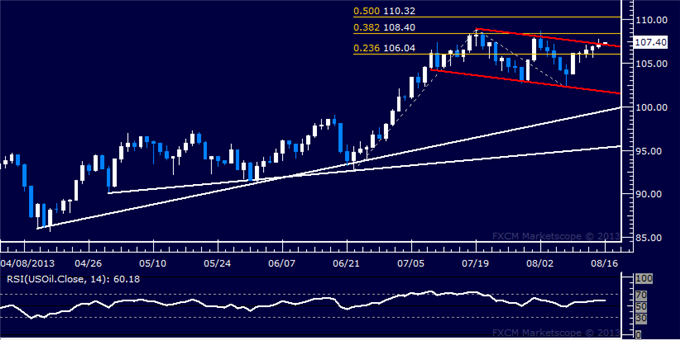
Daily Chart - Created Using FXCM Marketscope 2.0
--- Written by Ilya Spivak, Currency Strategist for Dailyfx.com
To contact Ilya, e-mail ispivak@dailyfx.com. Follow Ilya on Twitter at @IlyaSpivak
To be added to Ilya's e-mail distribution list, please CLICK HERE
New to FX? Watch this Video. For live market updates, visit the Real Time News Feed
DailyFX provides forex news and technical analysis on the trends that influence the global currency markets.
Learn forex trading with a free practice account and trading charts from FXCM.