
US Dollar Continues to Sink as S&P 500 Extends Advance
THE TAKEAWAY: The US Dollar faced a second consecutive day of aggressive selling while the S&P 500 continued to push higher, eyeing a challenge of the May swing high.
Capitalize on Shifts in Market Mood with the DailyFX Speculative Sentiment Index.
US DOLLAR TECHNICAL ANALYSIS – Prices turned lower as expected, with sellers now testing support at 10803 marked by the 38.2% Fibonacci retracement. A break downward on a daily closing basis exposes the 50% level at 10739. Near-term resistance is at 10882, the 23.6% level, with a move back above that eyeing the July 8 swing high at 11009.
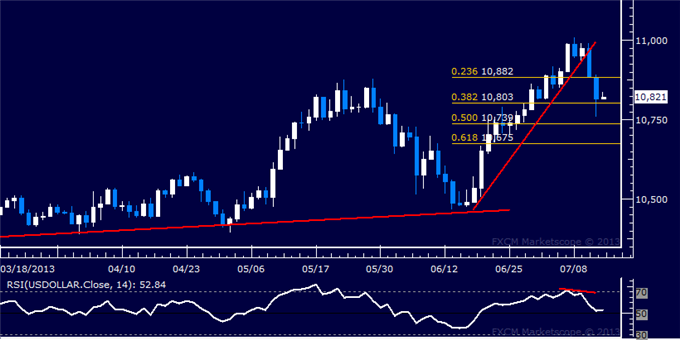
Daily Chart - Created Using FXCM Marketscope 2.0
S&P 500 TECHNICAL ANALYSIS – Prices moved higher as expected after putting in a bullish Piercing Line candlestick pattern. The bulls are now poised to challenge the 78.6% Fibonacci expansion at 1678.40, with a break above that targeting the May 22 high at 1687.40 and the 100% level at 1710.90. Near-term support is at 1652.90, the 61.8% Fib.
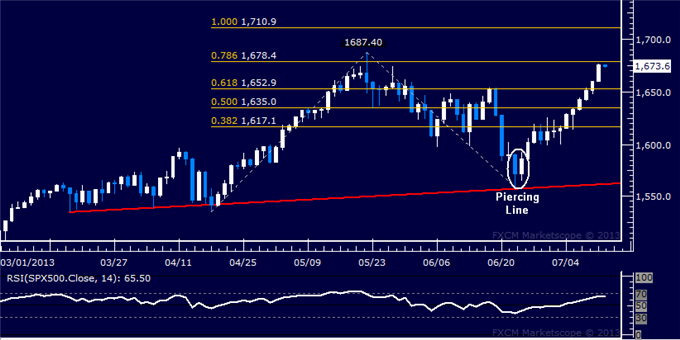
Daily Chart - Created Using FXCM Marketscope 2.0
GOLD TECHNICAL ANALYSIS – Prices advanced after putting in a Bullish Engulfing candlestick pattern, taking out resistance at the 23.6% Fibonacci retracement (1252.80) to expose the 38.2% level at 1297.75. A further push above that aims for the 50% Fib at 1334.08. The 1252.80 mark has been recast as near-term support.
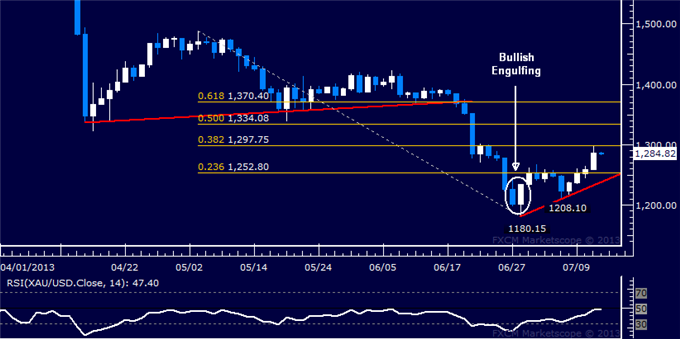
Daily Chart - Created Using FXCM Marketscope 2.0
CRUDE OIL TECHNICAL ANALYSIS– Prices put in a bearish Dark Cloud Cover candlestick pattern, hinting a move lower is ahead. Near-term support is at 103.93, the 23.6% Fibonacci retracement, with a break beneath that targeting a rising trend line at 102.18 and the 50% level at 100.05. Near-term resistance is at 107.41, the July 11 high.
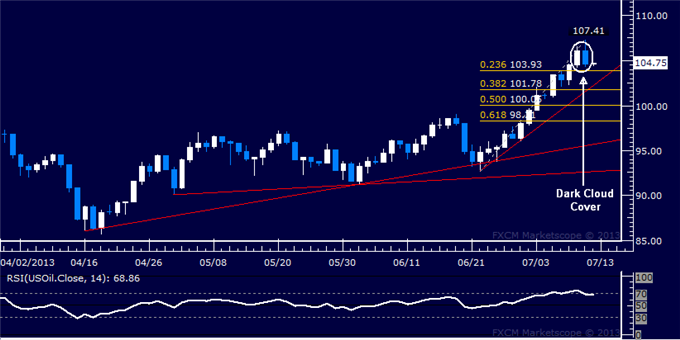
Daily Chart - Created Using FXCM Marketscope 2.0
--- Written by Ilya Spivak, Currency Strategist for Dailyfx.com
To contact Ilya, e-mail ispivak@dailyfx.com. Follow Ilya on Twitter at @IlyaSpivak
To be added to Ilya's e-mail distribution list, please CLICK HERE
New to FX? Watch this Video. For live market updates, visit the Real Time News Feed
DailyFX provides forex news and technical analysis on the trends that influence the global currency markets.
Learn forex trading with a free practice account and trading charts from FXCM.