
Should You Be Tempted To Sell RBL Bank Limited (NSE:RBLBANK) Because Of Its P/E Ratio?

Want to participate in a short research study? Help shape the future of investing tools and you could win a $250 gift card!
This article is for investors who would like to improve their understanding of price to earnings ratios (P/E ratios). To keep it practical, we'll show how RBL Bank Limited's (NSE:RBLBANK) P/E ratio could help you assess the value on offer. RBL Bank has a P/E ratio of 33.06, based on the last twelve months. That means that at current prices, buyers pay ₹33.06 for every ₹1 in trailing yearly profits.
Check out our latest analysis for RBL Bank
How Do I Calculate RBL Bank's Price To Earnings Ratio?
The formula for P/E is:
Price to Earnings Ratio = Share Price ÷ Earnings per Share (EPS)
Or for RBL Bank:
P/E of 33.06 = ₹669.55 ÷ ₹20.25 (Based on the year to March 2019.)
Is A High Price-to-Earnings Ratio Good?
A higher P/E ratio implies that investors pay a higher price for the earning power of the business. All else being equal, it's better to pay a low price -- but as Warren Buffett said, 'It's far better to buy a wonderful company at a fair price than a fair company at a wonderful price.'
How Growth Rates Impact P/E Ratios
Probably the most important factor in determining what P/E a company trades on is the earnings growth. If earnings are growing quickly, then the 'E' in the equation will increase faster than it would otherwise. And in that case, the P/E ratio itself will drop rather quickly. Then, a lower P/E should attract more buyers, pushing the share price up.
Notably, RBL Bank grew EPS by a whopping 29% in the last year. And its annual EPS growth rate over 5 years is 41%. With that performance, I would expect it to have an above average P/E ratio.
Does RBL Bank Have A Relatively High Or Low P/E For Its Industry?
One good way to get a quick read on what market participants expect of a company is to look at its P/E ratio. As you can see below, RBL Bank has a higher P/E than the average company (30.4) in the banks industry.
Its relatively high P/E ratio indicates that RBL Bank shareholders think it will perform better than other companies in its industry classification. The market is optimistic about the future, but that doesn't guarantee future growth. So investors should delve deeper. I like to check if company insiders have been buying or selling.
Remember: P/E Ratios Don't Consider The Balance Sheet
Don't forget that the P/E ratio considers market capitalization. In other words, it does not consider any debt or cash that the company may have on the balance sheet. Hypothetically, a company could reduce its future P/E ratio by spending its cash (or taking on debt) to achieve higher earnings.
Such spending might be good or bad, overall, but the key point here is that you need to look at debt to understand the P/E ratio in context.
How Does RBL Bank's Debt Impact Its P/E Ratio?
RBL Bank's net debt is 25% of its market cap. This could bring some additional risk, and reduce the number of investment options for management; worth remembering if you compare its P/E to businesses without debt.
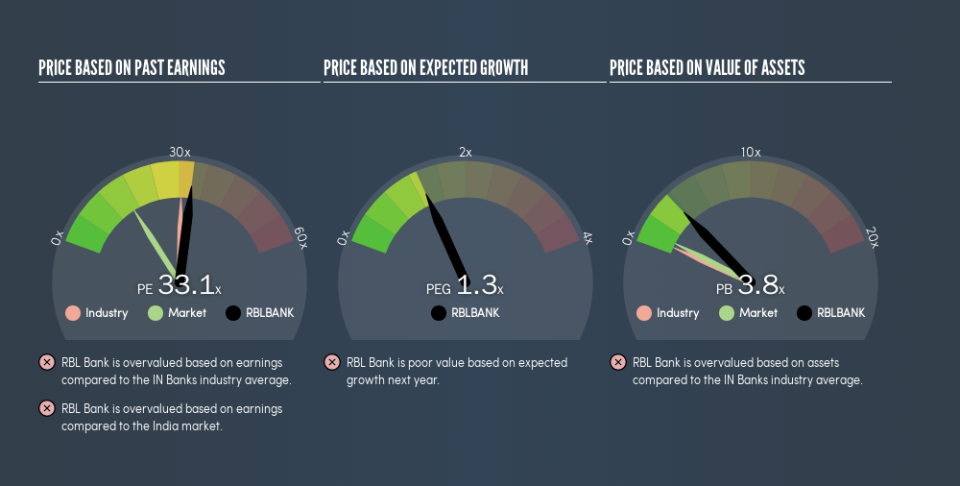
The Verdict On RBL Bank's P/E Ratio
RBL Bank has a P/E of 33.1. That's higher than the average in the IN market, which is 16.2. While the company does use modest debt, its recent earnings growth is very good. So on this analysis it seems reasonable that its P/E ratio is above average.
Investors have an opportunity when market expectations about a stock are wrong. As value investor Benjamin Graham famously said, 'In the short run, the market is a voting machine but in the long run, it is a weighing machine.' So this free visual report on analyst forecasts could hold the key to an excellent investment decision.
Of course, you might find a fantastic investment by looking at a few good candidates. So take a peek at this free list of companies with modest (or no) debt, trading on a P/E below 20.
We aim to bring you long-term focused research analysis driven by fundamental data. Note that our analysis may not factor in the latest price-sensitive company announcements or qualitative material.
If you spot an error that warrants correction, please contact the editor at editorial-team@simplywallst.com. This article by Simply Wall St is general in nature. It does not constitute a recommendation to buy or sell any stock, and does not take account of your objectives, or your financial situation. Simply Wall St has no position in the stocks mentioned. Thank you for reading.