
Who Are Sino-Ocean Group Holding Limited’s (HKG:3377) Major Shareholders?

A look at the shareholders of Sino-Ocean Group Holding Limited (HKG:3377) can tell us which group is most powerful. Institutions will often hold stock in bigger companies, and we expect to see insiders owning a noticeable percentage of the smaller ones. Companies that have been privatized tend to have low insider ownership.
With a market capitalization of HK$30.16b, Sino-Ocean Group Holding is rather large. We’d expect to see institutional investors on the register. Companies of this size are usually well known to retail investors, too. Our analysis of the ownership of the company, below, shows that institutional investors have bought into the company. We can zoom in on the different ownership groups, to learn more about 3377.
See our latest analysis for Sino-Ocean Group Holding
What Does The Institutional Ownership Tell Us About Sino-Ocean Group Holding?
Many institutions measure their performance against an index that approximates the local market. So they usually pay more attention to companies that are included in major indices.
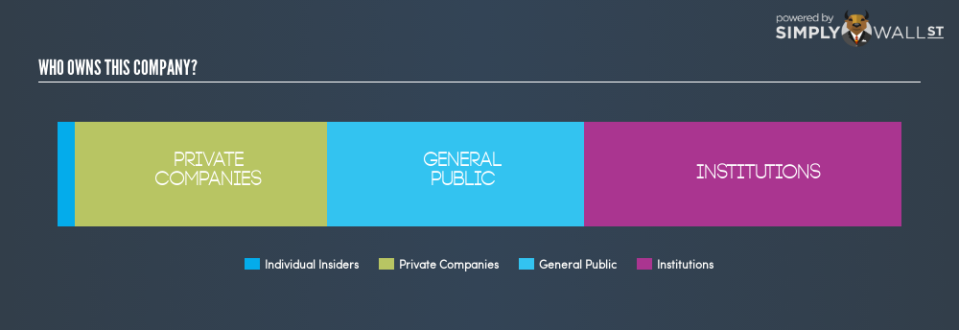
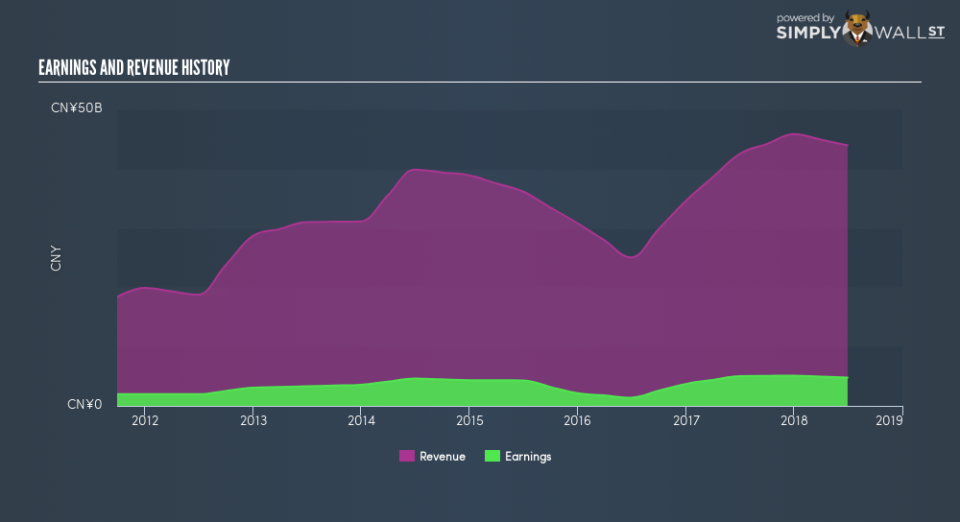
We can see that Sino-Ocean Group Holding does have institutional investors; and they hold 37.5% of the stock. This implies the analysts working for those institutions have looked at the stock and they like it. But just like anyone else, they could be wrong. When multiple institutions own a stock, there’s always a risk that they are in a ‘crowded trade’. When such a trade goes wrong, multiple parties may compete to sell stock fast. This risk is higher in a company without a history of growth. You can see Sino-Ocean Group Holding’s historic earnings and revenue, below, but keep in mind there’s always more to the story.
Sino-Ocean Group Holding is not owned by hedge funds. There are plenty of analysts covering the stock, so it might be worth seeing what they are forecasting, too.
Insider Ownership Of Sino-Ocean Group Holding
While the precise definition of an insider can be subjective, almost everyone considers board members to be insiders. Company management run the business, but the CEO will answer to the board, even if he or she is a member of it.
Insider ownership is positive when it signals leadership are thinking like the true owners of the company. However, high insider ownership can also give immense power to a small group within the company. This can be negative in some circumstances. We can see that insiders own shares in Sino-Ocean Group Holding Limited. This is a big company, so it is good to see this level of alignment. Insiders own HK$663.4m worth of shares (at current prices). Most would say this shows alignment of interests between shareholders and the board. Still, it might be worth checking if those insiders have been selling.
General Public Ownership
The general public, with a 30.4% stake in the company, will not easily be ignored. This size of ownership, while considerable, may not be enough to change company policy if the decision is not in sync with other large shareholders.
Private Company Ownership
We can see that Private Companies own 29.9%, of the shares on issue. Private companies may be related parties. Sometimes insiders have an interest in a public company through a holding in a private company, rather than in their own capacity as an individual. While it’s hard to draw any broad stroke conclusions, it is worth noting as an area for further research.
Next Steps:
It’s always worth thinking about the different groups who own shares in a company. But to understand Sino-Ocean Group Holding better, we need to consider many other factors.
Many find it useful to take an in depth look at how a company has performed in the past. You can access this detailed graph of past earnings, revenue and cash flow .
If you are like me, you may want to think about whether this company will grow of shrink. Luckily, you can check this free report showing analyst forecasts for its future.
NB: Figures in this article are calculated using data from the last twelve months, which refer to the 12-month period ending on the last date of the month the financial statement is dated. This may not be consistent with full year annual report figures.
To help readers see past the short term volatility of the financial market, we aim to bring you a long-term focused research analysis purely driven by fundamental data. Note that our analysis does not factor in the latest price-sensitive company announcements.
The author is an independent contributor and at the time of publication had no position in the stocks mentioned. For errors that warrant correction please contact the editor at editorial-team@simplywallst.com.