
NZD/USD Technical Analysis: Trying to Secure a Bottom
DailyFX.com -
To receive Ilya's analysis directly via email, please SIGN UP HERE
Talking Points:
NZD/USD Technical Strategy: Flat
Support: 0.7763, 0.7661, 0.7497
Resistance:0.7973, 0.8051, 0.8138
The New Zealand Dollar is attempting to form a bottom against its US counterpart after putting in a bullish Piercing Line candlestick pattern. A daily close above the 0.7928-73 area marked by the October 2 high and the 23.6% Fibonacci retracement exposes the February 4 low at 0.8051. Alternatively, a drop below the 14.6% Fibexpansion at 0.7763 opens the door for a test of the 0.7661-82 zone bracketed by the July 8 2013 low and the 23.6% threshold.
The dominant trend has argued in favor of the downside since early July. With that in mind, we will opt not to pursue a long position and look toward any upswing from here as an opportunity to establish short at a more favorable level.
Add these technical levels directly to your charts with our Support/Resistance Wizard app!
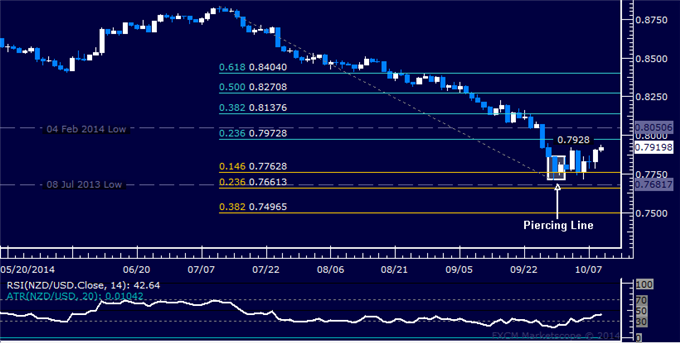
Daily Chart - Created Using FXCM Marketscope 2.0
--- Written by Ilya Spivak, Currency Strategist for DailyFX.com
DailyFX provides forex news and technical analysis on the trends that influence the global currency markets.
Learn forex trading with a free practice account and trading charts from FXCM.