
What Kind Of Shareholder Owns Most Excel Realty N Infra Limited (NSE:EXCEL) Stock?

The big shareholder groups in Excel Realty N Infra Limited (NSE:EXCEL) have power over the company. Institutions often own shares in more established companies, while it’s not unusual to see insiders own a fair bit of smaller companies. Warren Buffett said that he likes ‘a business with enduring competitive advantages that is run by able and owner-oriented people’. So it’s nice to see some insider ownership, because it may suggest that management is owner-oriented.
Excel Realty N Infra is not a large company by global standards. It has a market capitalization of ₹240m, which means it wouldn’t have the attention of many institutional investors. Taking a look at the our data on the ownership groups (below), it’s seems that institutions are noticeable on the share registry. Let’s take a closer look to see what the different types of shareholder can tell us about EXCEL.
See our latest analysis for Excel Realty N Infra

What Does The Institutional Ownership Tell Us About Excel Realty N Infra?
Institutions typically measure themselves against a benchmark when reporting to their own investors, so they often become more enthusiastic about a stock once it’s included in a major index. We would expect most companies to have some institutions on the register, especially if they are growing.
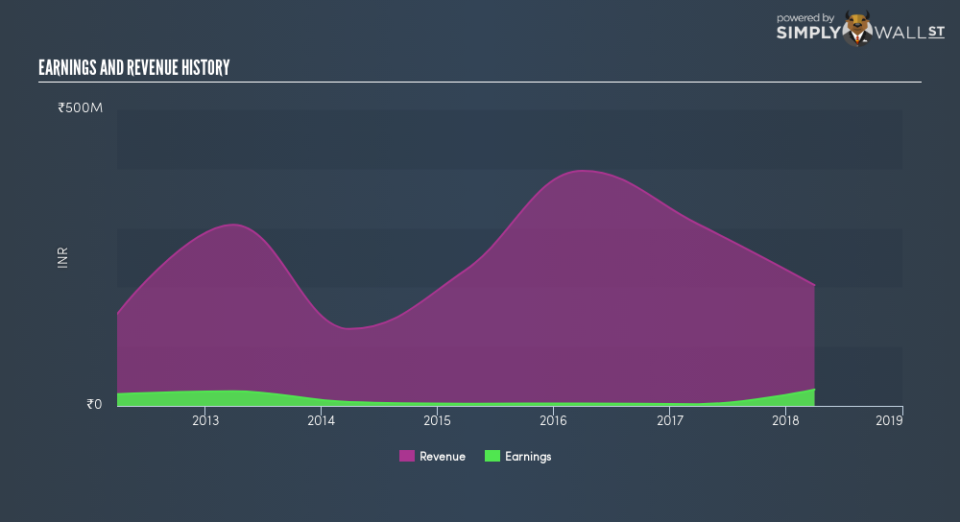
Excel Realty N Infra already has institutions on the share registry. Indeed, they own 12% of the company. This suggests some credibility amongst professional investors. But we can’t rely on that fact alone, since institutions make bad investments sometimes, just like everyone does. When multiple institutions own a stock, there’s always a risk that they are in a ‘crowded trade’. When such a trade goes wrong, multiple parties may compete to sell stock fast. This risk is higher in a company without a history of growth. You can see Excel Realty N Infra’s historic earnings and revenue, below, but keep in mind there’s always more to the story.
Hedge funds don’t have many shares in Excel Realty N Infra. We’re not picking up on any analyst coverage of the stock at the moment, so the company is unlikely to be widely held.
Insider Ownership Of Excel Realty N Infra
The definition of company insiders can be subjective, and does vary between jurisdictions. Our data reflects individual insiders, capturing board members at the very least. The company management answer to the board; and the latter should represent the interests of shareholders. Notably, sometimes top-level managers are on the board, themselves.
I generally consider insider ownership to be a good thing. However, on some occasions it makes it more difficult for other shareholders to hold the board accountable for decisions.
Our most recent data indicates that insiders own a reasonable proportion of Excel Realty N Infra Limited. Insiders own ₹116m worth of shares in the ₹240m company. This may suggest that the founders still own a lot of shares. You can click here to see if they have been buying or selling.
General Public Ownership
The general public, with a 32% stake in the company, will not easily be ignored. This size of ownership, while considerable, may not be enough to change company policy if the decision is not in sync with other large shareholders.
Private Company Ownership
It seems that Private Companies own 8.0%, of the EXCEL stock. It might be worth looking deeper into this. If related parties, such as insiders, have an interest in one of these private companies, that should be disclosed in the annual report. Private companies may also have a strategic interest in the company.
Next Steps:
While it is well worth considering the different groups that own a company, there are other factors that are even more important.
I like to dive deeper into how a company has performed in the past. You can find historic revenue and earnings in this detailed graph.
Of course, you might find a fantastic investment by looking elsewhere. So take a peek at this free list of interesting companies.
NB: Figures in this article are calculated using data from the last twelve months, which refer to the 12-month period ending on the last date of the month the financial statement is dated. This may not be consistent with full year annual report figures.
To help readers see past the short term volatility of the financial market, we aim to bring you a long-term focused research analysis purely driven by fundamental data. Note that our analysis does not factor in the latest price-sensitive company announcements.
The author is an independent contributor and at the time of publication had no position in the stocks mentioned. For errors that warrant correction please contact the editor at editorial-team@simplywallst.com.