
Here's What Objective Corporation Limited's (ASX:OCL) P/E Is Telling Us

Want to participate in a research study? Help shape the future of investing tools and earn a $60 gift card!
The goal of this article is to teach you how to use price to earnings ratios (P/E ratios). To keep it practical, we'll show how Objective Corporation Limited's (ASX:OCL) P/E ratio could help you assess the value on offer. Objective has a P/E ratio of 37.46, based on the last twelve months. That means that at current prices, buyers pay A$37.46 for every A$1 in trailing yearly profits.
View our latest analysis for Objective
How Do You Calculate A P/E Ratio?
The formula for P/E is:
Price to Earnings Ratio = Share Price ÷ Earnings per Share (EPS)
Or for Objective:
P/E of 37.46 = A$2.8 ÷ A$0.075 (Based on the year to December 2018.)
Is A High Price-to-Earnings Ratio Good?
A higher P/E ratio means that investors are paying a higher price for each A$1 of company earnings. That isn't a good or a bad thing on its own, but a high P/E means that buyers have a higher opinion of the business's prospects, relative to stocks with a lower P/E.
How Growth Rates Impact P/E Ratios
Earnings growth rates have a big influence on P/E ratios. Earnings growth means that in the future the 'E' will be higher. Therefore, even if you pay a high multiple of earnings now, that multiple will become lower in the future. A lower P/E should indicate the stock is cheap relative to others -- and that may attract buyers.
Objective saw earnings per share decrease by 20% last year. But it has grown its earnings per share by 12% per year over the last five years.
How Does Objective's P/E Ratio Compare To Its Peers?
The P/E ratio indicates whether the market has higher or lower expectations of a company. The image below shows that Objective has a P/E ratio that is roughly in line with the software industry average (34.9).
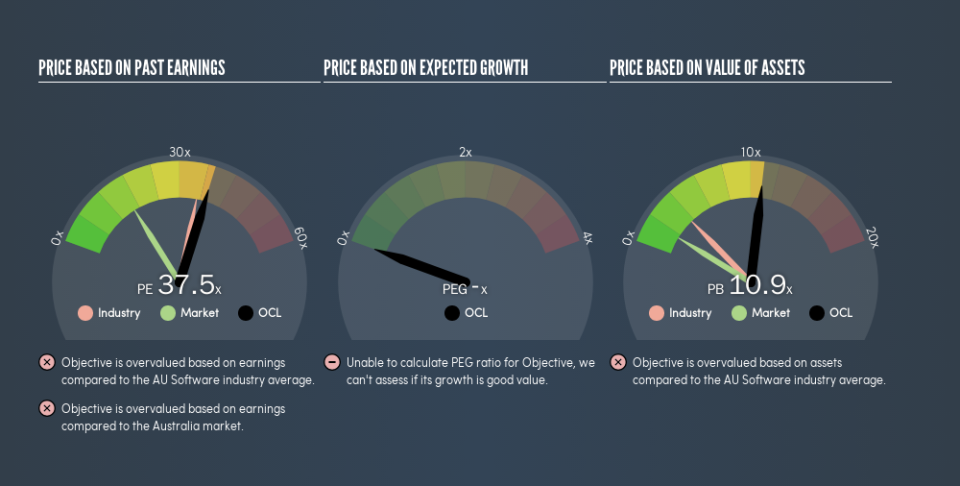
Objective's P/E tells us that market participants think its prospects are roughly in line with its industry. If the company has better than average prospects, then the market might be underestimating it. I inform my view byby checking management tenure and remuneration, among other things.
Don't Forget: The P/E Does Not Account For Debt or Bank Deposits
It's important to note that the P/E ratio considers the market capitalization, not the enterprise value. That means it doesn't take debt or cash into account. Hypothetically, a company could reduce its future P/E ratio by spending its cash (or taking on debt) to achieve higher earnings.
Spending on growth might be good or bad a few years later, but the point is that the P/E ratio does not account for the option (or lack thereof).
Objective's Balance Sheet
The extra options and safety that comes with Objective's AU$17m net cash position means that it deserves a higher P/E than it would if it had a lot of net debt.
The Verdict On Objective's P/E Ratio
Objective's P/E is 37.5 which is above average (16.3) in the AU market. The recent drop in earnings per share would make some investors cautious, but the net cash position means the company has time to improve: and the high P/E suggests the market thinks it will.
Investors should be looking to buy stocks that the market is wrong about. As value investor Benjamin Graham famously said, 'In the short run, the market is a voting machine but in the long run, it is a weighing machine.' Although we don't have analyst forecasts, you could get a better understanding of its growth by checking out this more detailed historical graph of earnings, revenue and cash flow.
You might be able to find a better buy than Objective. If you want a selection of possible winners, check out this free list of interesting companies that trade on a P/E below 20 (but have proven they can grow earnings).
We aim to bring you long-term focused research analysis driven by fundamental data. Note that our analysis may not factor in the latest price-sensitive company announcements or qualitative material.
If you spot an error that warrants correction, please contact the editor at editorial-team@simplywallst.com. This article by Simply Wall St is general in nature. It does not constitute a recommendation to buy or sell any stock, and does not take account of your objectives, or your financial situation. Simply Wall St has no position in the stocks mentioned. Thank you for reading.