
Here's What BGR Energy Systems Limited's (NSE:BGRENERGY) ROCE Can Tell Us

Want to participate in a short research study? Help shape the future of investing tools and you could win a $250 gift card!
Today we are going to look at BGR Energy Systems Limited (NSE:BGRENERGY) to see whether it might be an attractive investment prospect. Specifically, we're going to calculate its Return On Capital Employed (ROCE), in the hopes of getting some insight into the business.
Firstly, we'll go over how we calculate ROCE. Second, we'll look at its ROCE compared to similar companies. Last but not least, we'll look at what impact its current liabilities have on its ROCE.
What is Return On Capital Employed (ROCE)?
ROCE is a metric for evaluating how much pre-tax income (in percentage terms) a company earns on the capital invested in its business. In general, businesses with a higher ROCE are usually better quality. In brief, it is a useful tool, but it is not without drawbacks. Renowned investment researcher Michael Mauboussin has suggested that a high ROCE can indicate that 'one dollar invested in the company generates value of more than one dollar'.
So, How Do We Calculate ROCE?
Analysts use this formula to calculate return on capital employed:
Return on Capital Employed = Earnings Before Interest and Tax (EBIT) ÷ (Total Assets - Current Liabilities)
Or for BGR Energy Systems:
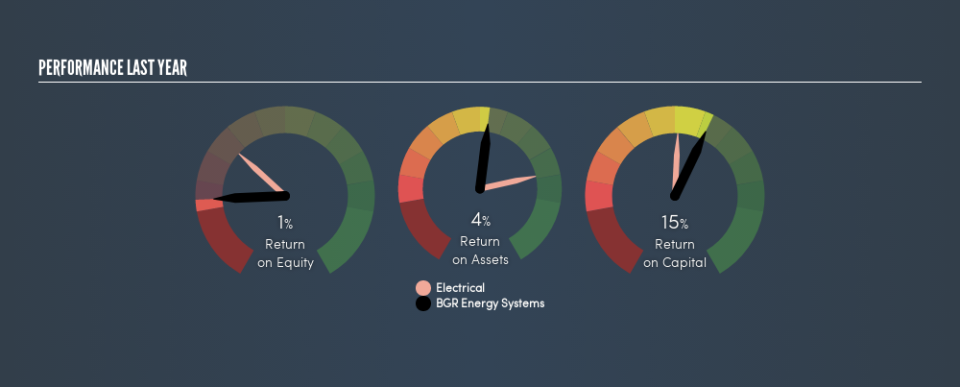
0.15 = ₹2.7b ÷ (₹67b - ₹49b) (Based on the trailing twelve months to March 2019.)
Therefore, BGR Energy Systems has an ROCE of 15%.
View our latest analysis for BGR Energy Systems
Is BGR Energy Systems's ROCE Good?
ROCE can be useful when making comparisons, such as between similar companies. Using our data, we find that BGR Energy Systems's ROCE is meaningfully better than the 12% average in the Electrical industry. We would consider this a positive, as it suggests it is using capital more effectively than other similar companies. Aside from the industry comparison, BGR Energy Systems's ROCE is mediocre in absolute terms, considering the risk of investing in stocks versus the safety of a bank account. Readers may find more attractive investment prospects elsewhere.
You can click on the image below to see (in greater detail) how BGR Energy Systems's past growth compares to other companies.
When considering ROCE, bear in mind that it reflects the past and does not necessarily predict the future. ROCE can be misleading for companies in cyclical industries, with returns looking impressive during the boom times, but very weak during the busts. ROCE is only a point-in-time measure. You can check if BGR Energy Systems has cyclical profits by looking at this free graph of past earnings, revenue and cash flow.
BGR Energy Systems's Current Liabilities And Their Impact On Its ROCE
Short term (or current) liabilities, are things like supplier invoices, overdrafts, or tax bills that need to be paid within 12 months. Due to the way the ROCE equation works, having large bills due in the near term can make it look as though a company has less capital employed, and thus a higher ROCE than usual. To counteract this, we check if a company has high current liabilities, relative to its total assets.
BGR Energy Systems has total assets of ₹67b and current liabilities of ₹49b. As a result, its current liabilities are equal to approximately 74% of its total assets. BGR Energy Systems has a fairly high level of current liabilities, meaningfully impacting its ROCE.
What We Can Learn From BGR Energy Systems's ROCE
Notably, it also has a mediocre ROCE, which to my mind is not an appealing combination. Of course, you might also be able to find a better stock than BGR Energy Systems. So you may wish to see this free collection of other companies that have grown earnings strongly.
If you like to buy stocks alongside management, then you might just love this free list of companies. (Hint: insiders have been buying them).
We aim to bring you long-term focused research analysis driven by fundamental data. Note that our analysis may not factor in the latest price-sensitive company announcements or qualitative material.
If you spot an error that warrants correction, please contact the editor at editorial-team@simplywallst.com. This article by Simply Wall St is general in nature. It does not constitute a recommendation to buy or sell any stock, and does not take account of your objectives, or your financial situation. Simply Wall St has no position in the stocks mentioned. Thank you for reading.