
Gold Drops to Three-Month Low, US Dollar Sets New 2014 High
DailyFX.com -
Talking Points:
US Dollar Rallies Most in 15 Months, Sets a New 2014 High
S&P 500 Continues to Oscillate in a Narrow Trading Range
Crude Oil May Rebound, Gold Down to a Three-Month Low
Can’t access the Dow Jones FXCM US Dollar Index? Try the USD basket on Mirror Trader. **
US DOLLAR TECHNICAL ANALYSIS – Prices scored their largest one-day rally in 15 months and rose to set a new 2014 high.A daily close above the 76.4% Fibonacci expansion at 10844 exposes the 100% level at 10914. Alternatively, a turn below the 61.8% Fib at 10800 clears the way for a test of the 10756-65 area, marked by the January 2014 high and the 50% expansion.
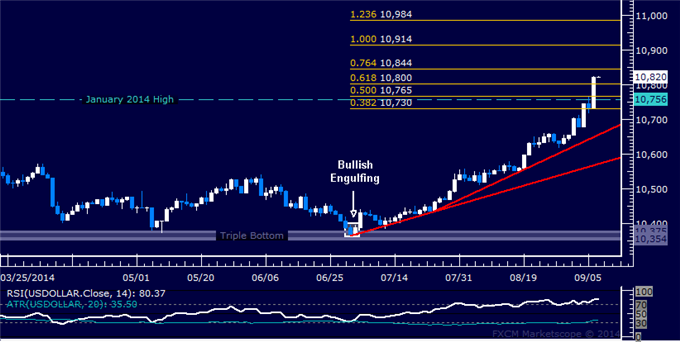
Daily Chart - Created Using FXCM Marketscope 2.0
** The Dow Jones FXCM US Dollar Index and the Mirror Trader USD basket are not the same product.
S&P 500 TECHNICAL ANALYSIS – Prices are testing the 61.8% Fibonacci expansionat 2006.80. A turn lower from here sees near-term support in the 1985.30-91.40 area, marked by the July 24 high and the 50% level, with a break below that on a daily closing basis exposing the 38.2% Fib at 1963.70. Alternatively, a turn above 2006.80 targets the top of the index’s long-term uptrend and the 76.4% expansion at 2033.40.
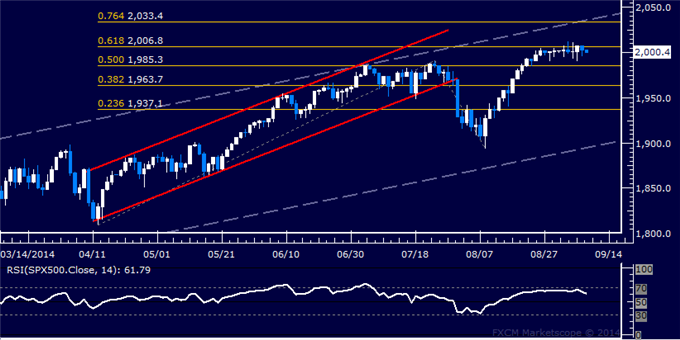
Daily Chart - Created Using FXCM Marketscope 2.0
GOLD TECHNICAL ANALYSIS – Prices are testing support at 1252.82, the 23.6% Fibonacci expansion, with a break below that on a daily closing basis exposing 38.2% level at 1239.98. Alternatively, a turn back above 1260.73, the intersection of falling channel floor support-turned-resistance and the 14.6% Fib, aims for a horizontal pivot at 1276.48.
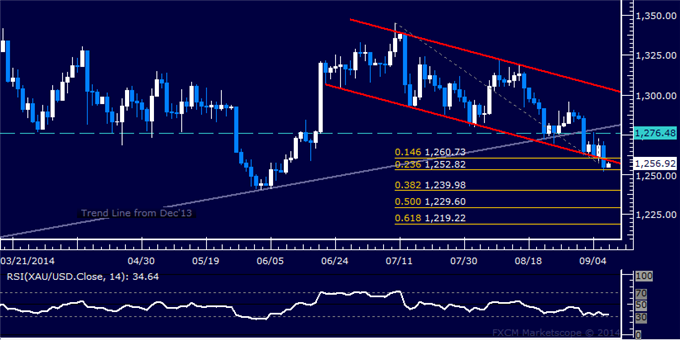
Daily Chart - Created Using FXCM Marketscope 2.0
CRUDE OIL TECHNICAL ANALYSIS – Prices appear to be carving out a falling wedge chart formation, pointing to ebbing downward momentum and hinting a reversal may be ahead. Positive RSI divergence bolsters the case for an upside scenario. A break above wedge top resistance at 102.10 exposes the August 26 high at 103.36. Alternatively, a turn below the 99.61-91 area marked by the 23.6% Fibonacci expansion and the wedge floor aims for the 38.2% level at 97.77.
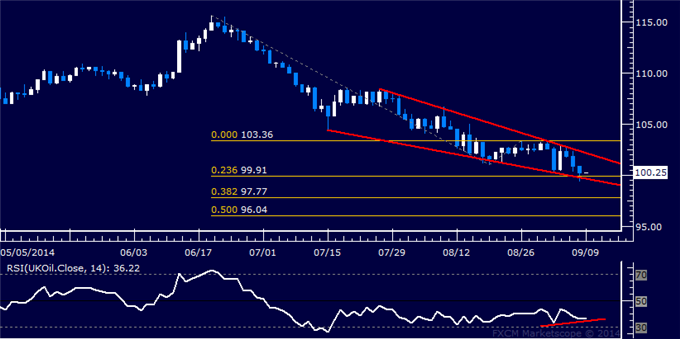
Daily Chart - Created Using FXCM Marketscope 2.0
--- Written by Ilya Spivak, Currency Strategist for DailyFX.com
To receive Ilya's analysis directly via email, please SIGN UP HERE
Contact and follow Ilya on Twitter: @IlyaSpivak
DailyFX provides forex news and technical analysis on the trends that influence the global currency markets.
Learn forex trading with a free practice account and trading charts from FXCM.