
Will gold bulls be able to break $1267 to gain further bullish momentum?
Gold remained under selling pressure last week amid hawkish FOMC minutes but worst than expected US Non-Farm Payrolls on Friday helped precious metal print both daily and weekly closing on positive note.
Technical Outlook
Gold ended last week at $1247 / ounce with a big bullish engulfing candle just ahead of a key resistance zone. Bullion is likely to find a tough resistance around $1250 as it is a historical support turned resistance area and 38.2% fib level also sits in at 1250.19. A break and daily close above this region would be targeting $1267, swing high of previous upward wave and then $1271, another major hurdle for bulls, as it is 50% fib level of recent move down.
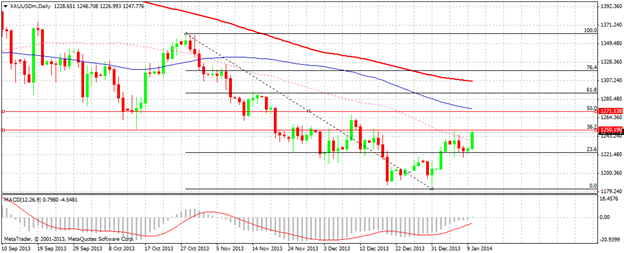
On downside, immediate support is seen around $1239 which is 55 DMA. A daily close below this support may open doors for $1224 and then $1180-82, a very strong hurdle for beers.
Swing Analysis
We have swing high of previous wave at $1267; have a look at the following chart:
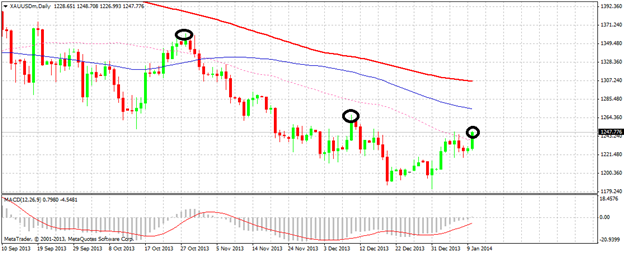
If gold bulls get success in extending the current wave above $1267 this would turn our bias into bullish, a Higher High (HH) is very much needed for long term bullish trend in precious metal.
Elliott Wave Pattern
This is how Elliott Wave Theory applies to recent price movement in XAU/USD;
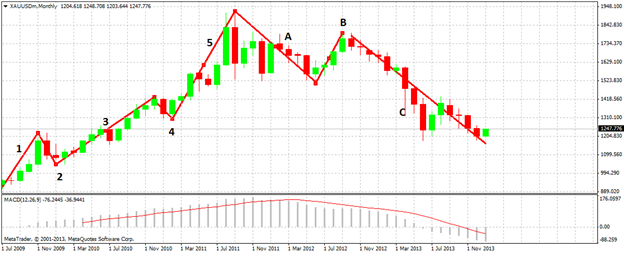
As you can see in the above monthly chart that gold is undergoing through last correction phase of EW pattern which is about to end in near future.
It is pertinent that significant negative divergence may also be noted with MACD on four hour timeframe which shows downside risk in short term.
Double Bottom Price Pattern
If we look at weekly chart, a classic double bottom pattern is obvious as shown below;
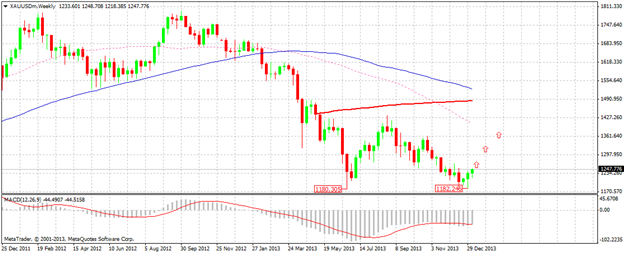
The neckline of this pattern is however at $1433, very far from current levels, that needs to be broken for stronger bullish trend eyeing $1700 in long term. This could only be possible if something big happens on fundamentals front such as the US economy once again falls into recession or anything like that, otherwise the completion of this double bottom pattern is a less likely scenario.
Fundamental Outlook
Gold posted a whopping 28% slump last year, the worst fall in three decades amid growth optimism in the United States and significant reduction in demand from India. Many investors lost faith in precious metal after it crashed in June last year.
The US Central Bank is all set to scale back the unprecedented stimulus which was an emergency measure to pull the crisis hit economy out of recession. Further tapering in near future would strengthen the US Dollar that in turn may aggravate losses in the precious metal.
India has also increased import duty on gold in a bid to deal with its growing current account deficit; this factor is also encouraging gold bears. However, we have been seeing an increase in China’s physical demand for precious metal since the beginning of the New Year that helped Gold pullback to a considerable extent.
In conclusion I would say that a daily close above $1267 is very much needed in order to expect more upside movement in gold price, failing to which shall again be targeting $1180-85 support zone.
DailyFX provides forex news and technical analysis on the trends that influence the global currency markets.
Learn forex trading with a free practice account and trading charts from FXCM.