
Gold Aiming to Extend Down Move After Hitting 9-Month Low
DailyFX.com -
Talking Points:
US Dollar Sets 4-Year High, Working on 7th Straight Up Day
S&P 500 Edging Downward as Sellers Eye September Bottom
Gold Aims to Extend Down Move After Hitting a 9-Month Low
Can’t access the Dow Jones FXCM US Dollar Index? Try the USD basket on Mirror Trader. **
US DOLLAR TECHNICAL ANALYSIS – Prices are working on a seventh consecutive advance, extending to a new four-year high. A daily close above the 38.2% Fibonacci expansion at 11130 exposes the 50% level at 11200. Alternatively, a reversal back below the 23.6% Fib at 11043 clears the way for a test of rising trend line support at 11016.
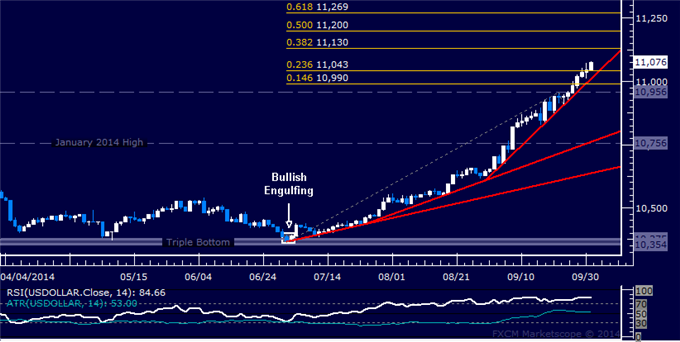
Daily Chart - Created Using FXCM Marketscope 2.0
** The Dow Jones FXCM US Dollar Index and the Mirror Trader USD basket are not the same product.
S&P 500 TECHNICAL ANALYSIS – Prices continue to edge lower with a falling channel. Near-term support is 1963.40, the September 29 swing low, with a break below that on a daily closing basis exposing the channel floor at 1941.60. Alternatively, a move above the channel top at 1976.60 targets the 23.6% Fibonacci expansion at 1994.60.
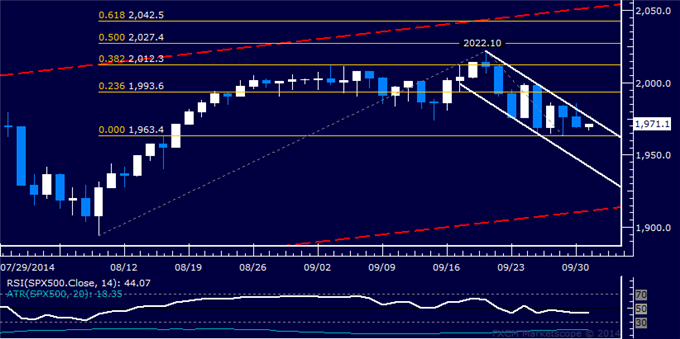
Daily Chart - Created Using FXCM Marketscope 2.0
GOLD TECHNICAL ANALYSIS – Prices resumed its down trend after a brief consolidative period, with sellers now aiming to test the 23.6% Fibonacci expansion at 1198.47. A break below that on a daily closing basis exposes the 1178.23-86 area marked by the 38.2% level and the December 31 2013 low. Alternatively, a turn back above the 14.6% Fib at 1210.94 aims for range top resistance at 1225.38.
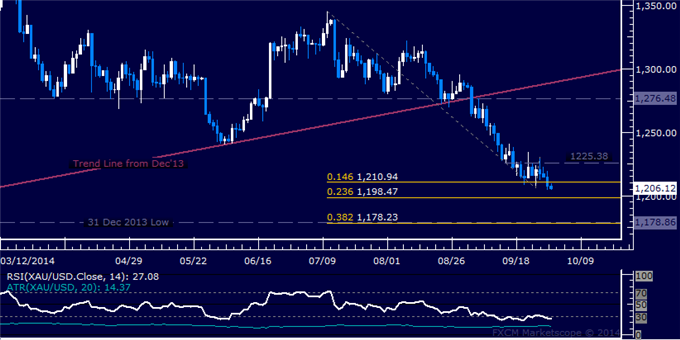
Daily Chart - Created Using FXCM Marketscope 2.0
CRUDE OIL TECHNICAL ANALYSIS – Prices edged past support at 95.11, the 23.6% Fibonacci expansion, to challenge falling channel floor support at 94.14. A break below that exposes the 38.2% level at 92.34. Alternatively, a turn back above the 95.11 eyes the 96.73-82 area, marked by the April 18 2013 low and the 14.6% Fib.
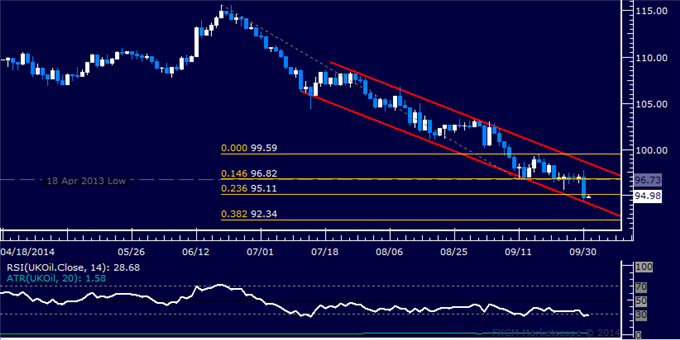
Daily Chart - Created Using FXCM Marketscope 2.0
--- Written by Ilya Spivak, Currency Strategist for DailyFX.com
To receive Ilya's analysis directly via email, please SIGN UP HERE
Contact and follow Ilya on Twitter: @IlyaSpivak
DailyFX provides forex news and technical analysis on the trends that influence the global currency markets.
Learn forex trading with a free practice account and trading charts from FXCM.