
GBP/USD Technical Analysis: Rally Stalls at Resistance
GBP/USD Technical Analysis – Prices pulled back from resistance at 1.5171 marked the 38.2% Fibonacci retracement and reinforced by a formerly broken rising trend line. Near-term support is at 1.5034, the 23.6% level. Alternatively, a reversal above resistance targets the 50% Fib at 1.5281.
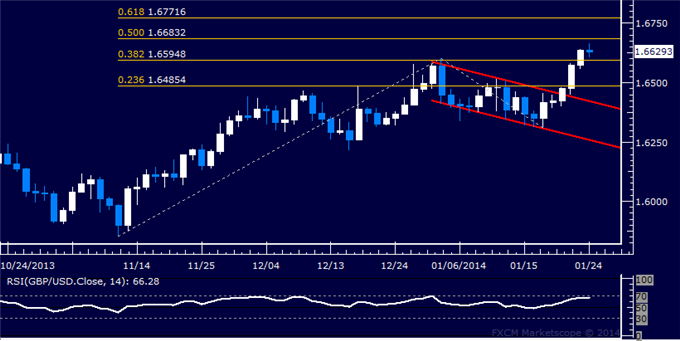
Daily Chart - Created Using FXCM Marketscope 2.0
--- Written by Ilya Spivak, Currency Strategist for Dailyfx.com
To contact Ilya, e-mail ispivak@dailyfx.com. Follow Ilya on Twitter at @IlyaSpivak
To be added to Ilya's e-mail distribution list, please CLICK HERE
New to FX? Watch this Video. For live market updates, visit the Real Time News Feed
DailyFX provides forex news and technical analysis on the trends that influence the global currency markets.
Learn forex trading with a free practice account and trading charts from FXCM.