
Forex: USD/CAD Technical Analysis – Sideways Trade Continues
To receive Ilya's analysis directly via email, please SIGN UP HERE
Talking Points:
USD/CAD Technical Strategy: Flat
Support: 1.1053-61 (Feb 25 low, 14.6% Fib exp.), 1.0909 (Feb 19 low)
Resistance: 1.1155 (23.6% Fib exp.), 1.1194 (Feb 21 high), 1.1223 (Jan 31 high)
Prices continue to oscillate below resistance at 1.1155, the 23.6% Fibonacci expansion. A break higher on a daily closing basis exposes recent swing highs in the 1.1194-1.1223 area, followed by the 38.2% level at 1.1307. Near-term support is in the 1.1053-61 region, defined by the February 25 low and the 14.6% Fib. A reversal beneath this barrier exposes the February 19 low at 1.0909.
A long position at current levels is premature absent a confirmation on a break above range resistance. A short trade looks is likewise unconfirmed and unattractive from a risk/reward perspective with the pair in close proximity to near-term support. We will opt to remain flat for the time being.
Confirm your chart-based trade setups with the Technical Analyzer. New to FX? Start Here!
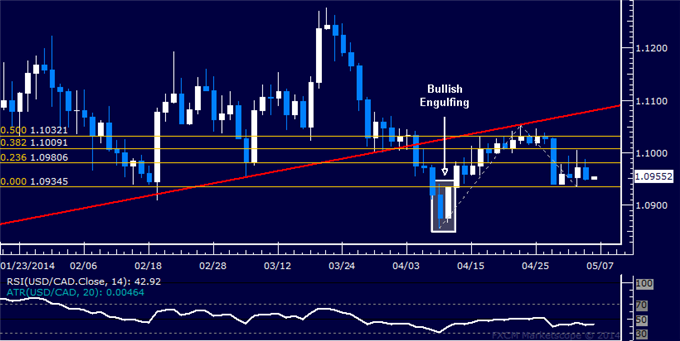
Daily Chart - Created Using FXCM Marketscope 2.0
--- Written by Ilya Spivak, Currency Strategist for DailyFX.com
DailyFX provides forex news and technical analysis on the trends that influence the global currency markets.
Learn forex trading with a free practice account and trading charts from FXCM.