
Forex Analysis: US Dollar Clings to Support as S&P 500 Recovers
THE TAKEAWAY: The US Dollar continues to grasp at the last vestiges of near-term support while the S&P 500 has launched a sharp recovery in a bid to overturn bearish positioning.
US DOLLAR TECHNICAL ANALYSIS– Prices broke rising trend line support set from the mid-September bottom, exposing a neckline barrier at 9926. A further drop below that exposes the bottom of a Flag formation at 9875. Trend line support-turned-resistance is at 9950, with a break above that targeting the Flag top at 9959 and the 23.6% Fibonacci expansion at 9995.
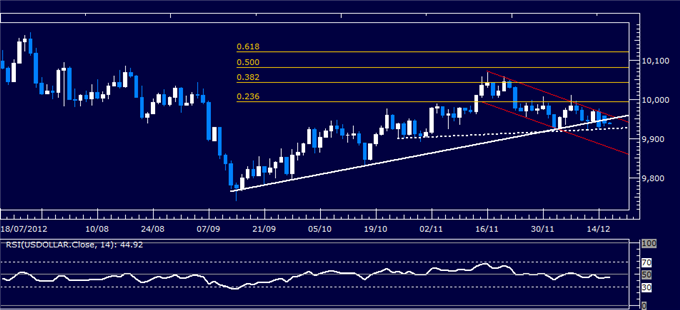
Daily Chart - Created Using FXCM Marketscope 2.0
S&P 500 TECHNICAL ANALYSIS – Prices rebounded from the bottom of a minor rising channel bottom set from late November to challenge resistance at a falling trend line set from the September 14 high (1439.10). This barrier is reinforced by the channel top at 1443.40, with a break above that exposing 1466.10. Alternatively, a drop below channel bottom (1416.30) aims for 1396.40.
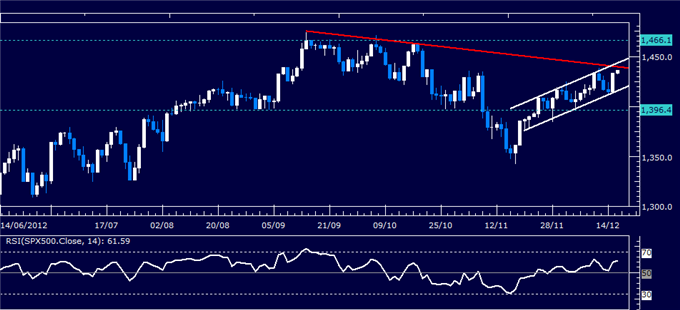
Daily Chart - Created Using FXCM Marketscope 2.0
GOLD TECHNICAL ANALYSIS – Prices broke lower after putting in a Bearish Engulfing candlestick pattern, taking out support at the bottom of a rising channel set from early November. Sellers are now testing support at 1692.41, the 50% Fibonacci expansion. A break below that exposes the 61.8% level at 1677.84. Channel support-turned-resistance is at 1729.27, with a break above that broadly targeting 1752.55 anew.
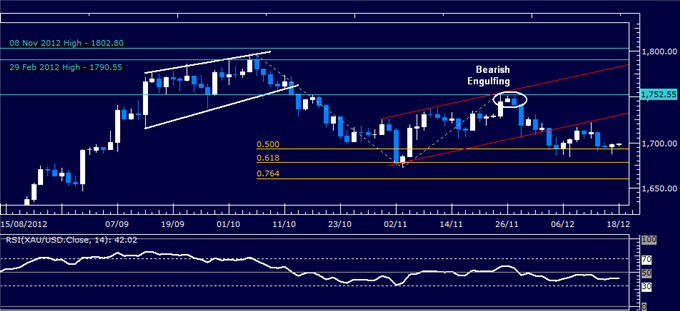
Daily Chart - Created Using FXCM Marketscope 2.0
Want to learn more about RSI? Watch this Video.
CRUDE OIL TECHNICAL ANALYSIS– Prices bounced from support at 85.61, the 50% Fibonacci expansion, to approach range top resistance at 89.19. A push above that initially aims for the December 3 high at 90.31. Alternatively, a break below that exposes the 61.8% Fib at 84.50.

Daily Chart - Created Using FXCM Marketscope 2.0
--- Written by Ilya Spivak, Currency Strategist for Dailyfx.com
To contact Ilya, e-mail ispivak@dailyfx.com. Follow Ilya on Twitter at @IlyaSpivak
To be added to Ilya's e-mail distribution list, please CLICK HERE
DailyFX provides forex news and technical analysis on the trends that influence the global currency markets.
Learn forex trading with a free practice account and trading charts from FXCM.