
Forex Analysis: US Dollar, Benchmark Assets Stall in Quiet Holiday Trade
THE TAKEAWAY: The US Dollar and benchmark assets tracking commodities and equities have stalled near familiar technical levels in quiet trade forced by the US Thanksgiving holiday.
US DOLLAR TECHNICAL ANALYSIS– Prices are consolidating above support at the 23.6% Fibonacci retracement (9993), a barrier reinforced by a rising trend line set from the October 17 low (10009). Initial resistance is at 10071, the November 16 high, with a push above that targeting the 38.2% Fib expansion at 10123. Alternatively, a drop below 9993 exposes the 38.2% Fib at 9945.
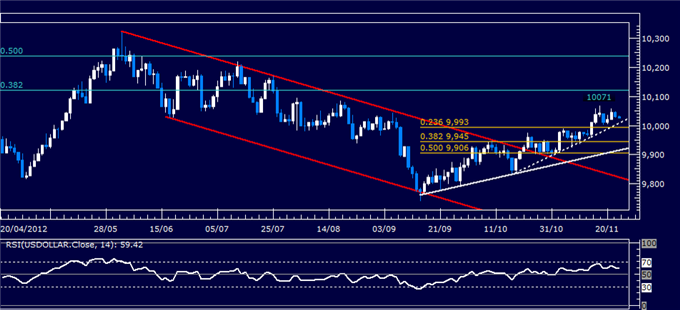
Daily Chart - Created Using FXCM Marketscope 2.0
S&P 500 TECHNICAL ANALYSIS – Prices rebounded as expected after completing Bullish Engulfing candlestick pattern. The prices have now edged past the 38.2% Fibonacci retracement at 1392.80, exposing the 1400 figure and the 50% level at 1408.50. Near-term support is at 1373.40, the 23.6% retracement, with a drop below that aiming to challenge the November 16 low at 1342.10.
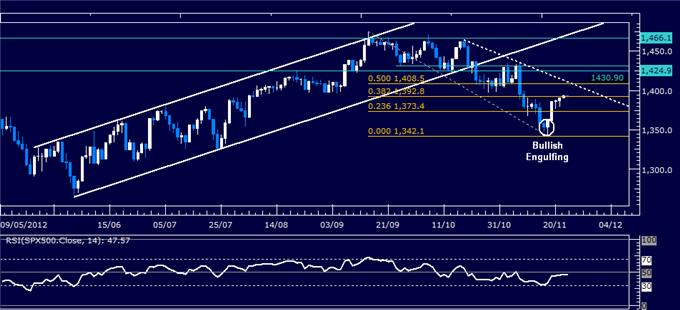
Daily Chart - Created Using FXCM Marketscope 2.0
GOLD TECHNICAL ANALYSIS – Prices may be carving a bullish Inverse Head and Shoulders chart pattern. Confirmation requires a close above neckline resistance at 1737.28, 23.6% Fibonacci retracement. This would imply a measured upside target at 1802.06. Near-term support lines up at 1688.65, the 38.2% Fib. This is reinforced by the 1700 figure and a rising trend line at 1691.82. A push below the latter level exposes the 50% retracement at 1642.57.
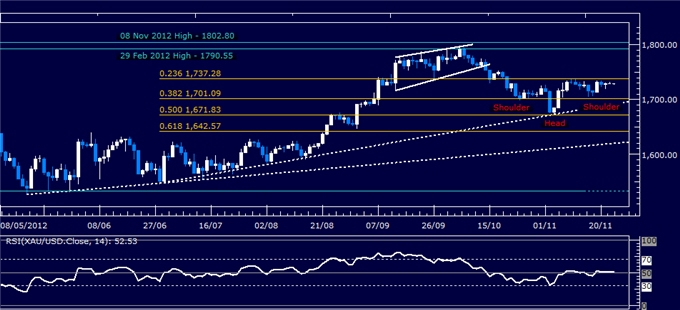
Daily Chart - Created Using FXCM Marketscope 2.0
Want to learn more about RSI? Watch this Video.
CRUDE OIL TECHNICAL ANALYSIS– Prices pulled back from resistance at 89.48, the 23.6% Fibonacci expansion, after breaking above a falling trend line set from the September 14 high (now at 85.31). A drop below that exposes the November 7 low at 84.04. Alternatively, a push above resistance targets the 38.2% level at 92.88.
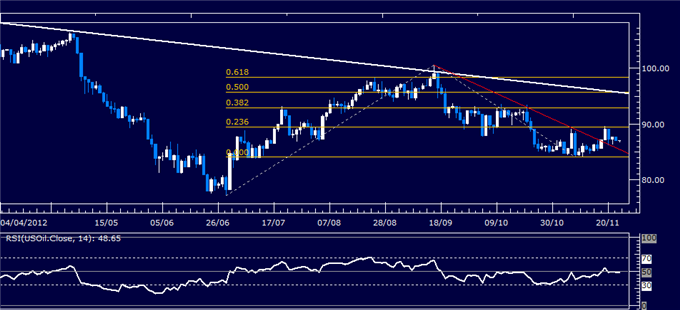
Daily Chart - Created Using FXCM Marketscope 2.0
--- Written by Ilya Spivak, Currency Strategist for Dailyfx.com
To contact Ilya, e-mail ispivak@dailyfx.com. Follow Ilya on Twitter at @IlyaSpivak
To be added to Ilya's e-mail distribution list, please CLICK HERE
DailyFX provides forex news and technical analysis on the trends that influence the global currency markets.
Learn forex trading with a free practice account and trading charts from FXCM.