
Forex Analysis: Dollar Breaks Down But S&P 500 Drop May Cap Weakness
THE TAKEAWAY: The US Dollar broke key technical support but signs of a looming bearish turn from the S&P 500 hint the return of haven demand may offer a lifeline to the greenback.
US DOLLAR TECHNICAL ANALYSIS– Prices broke through support at the bottom of a rising channel set from mid-September, exposing the 38.2% Fibonacci retracement at 9945. A break below that targets the 50% level at 9906. The channel bottom, now at 9970, has been recast as near-term resistance. A reversal back above that aims for the 23.6% Fib at 9993.
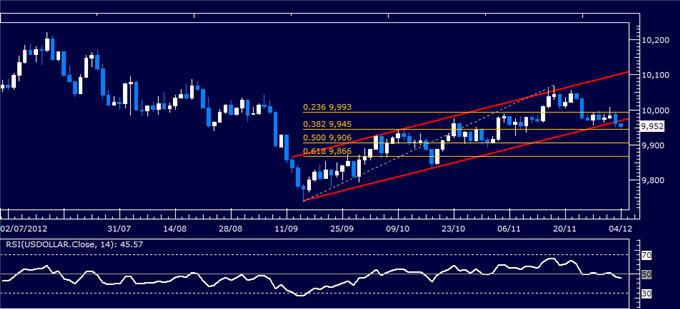
Daily Chart - Created Using FXCM Marketscope 2.0
S&P 500 TECHNICAL ANALYSIS – Prices put in a bearish Evening Star candlestick pattern below resistance in the 1424.90-1430.90 area, hinting the upward correction witnessed since mid-September may be over and the dominant down trend ready to resume. Initial support lines up at 1394.30, the 23.6% Fibonacci expansion. A break below that targets the 38.2% level at 1374.90. Alternatively, a push above 1430.90 exposes the familiar triple top at 1466.10.
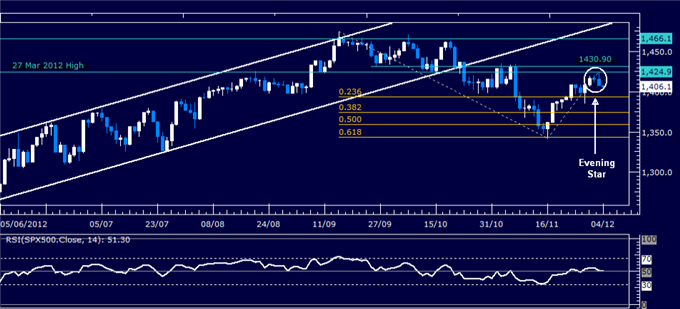
Daily Chart - Created Using FXCM Marketscope 2.0
GOLD TECHNICAL ANALYSIS – Prices turned lower after putting in a Bearish Engulfing candlestick pattern below the 61.8% Fibonacci retracement (1748.70), dropping past the 38.2% level at 1719.60. Sellers now target the 23.6% Fib at 1701.60, a barrier reinforced by a rising trend line set from late June. A push below that initially targets the November 5 low at 1672.50. The 1719.60 level has been recast as initial resistance, with a reversal back above that aiming for the 50% retracement at 1734.15.

Daily Chart - Created Using FXCM Marketscope 2.0
Want to learn more about RSI? Watch this Video.
CRUDE OIL TECHNICAL ANALYSIS– Prices put in a Shooting Star candlestick below resistance at the 23.6% Fibonacci expansion (89.48), a barrier reinforced by a minor rising channel top at 90.50, hinting a move lower is ahead. Near-term support is at 87.42, the 14.6% Fib, with a break below that exposing the channel bottom at 85.56 as well as the November 7 low at 84.04. Alternatively a break above 90.50 exposes the 38.2% expansion at 92.87.
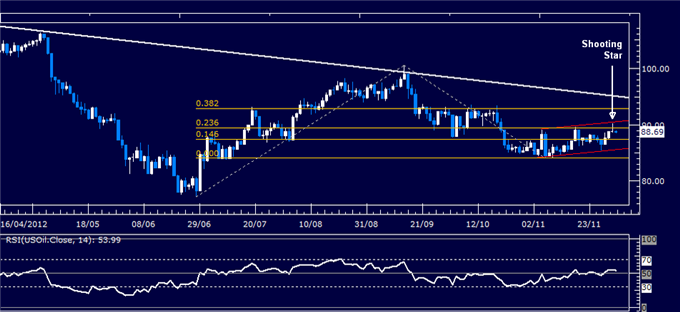
Daily Chart - Created Using FXCM Marketscope 2.0
--- Written by Ilya Spivak, Currency Strategist for Dailyfx.com
To contact Ilya, e-mail ispivak@dailyfx.com. Follow Ilya on Twitter at @IlyaSpivak
To be added to Ilya's e-mail distribution list, please CLICK HERE
DailyFX provides forex news and technical analysis on the trends that influence the global currency markets.
Learn forex trading with a free practice account and trading charts from FXCM.