
The five-year shareholder returns and company earnings persist lower as YTL Corporation Berhad (KLSE:YTL) stock falls a further 4.4% in past week
In order to justify the effort of selecting individual stocks, it's worth striving to beat the returns from a market index fund. But every investor is virtually certain to have both over-performing and under-performing stocks. At this point some shareholders may be questioning their investment in YTL Corporation Berhad (KLSE:YTL), since the last five years saw the share price fall 55%.
After losing 4.4% this past week, it's worth investigating the company's fundamentals to see what we can infer from past performance.
See our latest analysis for YTL Corporation Berhad
There is no denying that markets are sometimes efficient, but prices do not always reflect underlying business performance. By comparing earnings per share (EPS) and share price changes over time, we can get a feel for how investor attitudes to a company have morphed over time.
YTL Corporation Berhad became profitable within the last five years. That would generally be considered a positive, so we are surprised to see the share price is down. Other metrics might give us a better handle on how its value is changing over time.
We note that the dividend has fallen in the last five years, so that may have contributed to the share price decline.
The image below shows how earnings and revenue have tracked over time (if you click on the image you can see greater detail).
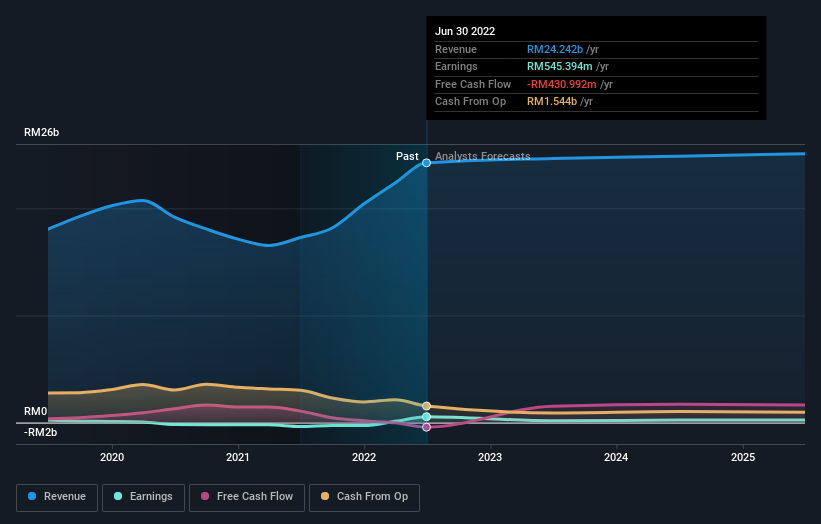
We know that YTL Corporation Berhad has improved its bottom line lately, but what does the future have in store? If you are thinking of buying or selling YTL Corporation Berhad stock, you should check out this free report showing analyst profit forecasts.
What About Dividends?
As well as measuring the share price return, investors should also consider the total shareholder return (TSR). The TSR is a return calculation that accounts for the value of cash dividends (assuming that any dividend received was reinvested) and the calculated value of any discounted capital raisings and spin-offs. It's fair to say that the TSR gives a more complete picture for stocks that pay a dividend. As it happens, YTL Corporation Berhad's TSR for the last 5 years was -46%, which exceeds the share price return mentioned earlier. And there's no prize for guessing that the dividend payments largely explain the divergence!
A Different Perspective
While the broader market lost about 5.6% in the twelve months, YTL Corporation Berhad shareholders did even worse, losing 6.5% (even including dividends). However, it could simply be that the share price has been impacted by broader market jitters. It might be worth keeping an eye on the fundamentals, in case there's a good opportunity. Unfortunately, longer term shareholders are suffering worse, given the loss of 8% doled out over the last five years. We'd need to see some sustained improvements in the key metrics before we could muster much enthusiasm. It's always interesting to track share price performance over the longer term. But to understand YTL Corporation Berhad better, we need to consider many other factors. Case in point: We've spotted 3 warning signs for YTL Corporation Berhad you should be aware of, and 2 of them shouldn't be ignored.
If you would prefer to check out another company -- one with potentially superior financials -- then do not miss this free list of companies that have proven they can grow earnings.
Please note, the market returns quoted in this article reflect the market weighted average returns of stocks that currently trade on MY exchanges.
Have feedback on this article? Concerned about the content? Get in touch with us directly. Alternatively, email editorial-team (at) simplywallst.com.
This article by Simply Wall St is general in nature. We provide commentary based on historical data and analyst forecasts only using an unbiased methodology and our articles are not intended to be financial advice. It does not constitute a recommendation to buy or sell any stock, and does not take account of your objectives, or your financial situation. We aim to bring you long-term focused analysis driven by fundamental data. Note that our analysis may not factor in the latest price-sensitive company announcements or qualitative material. Simply Wall St has no position in any stocks mentioned.
Join A Paid User Research Session
You’ll receive a US$30 Amazon Gift card for 1 hour of your time while helping us build better investing tools for the individual investors like yourself. Sign up here