
Examining K & P International Holdings Limited’s (HKG:675) Weak Return On Capital Employed

Today we are going to look at K & P International Holdings Limited (HKG:675) to see whether it might be an attractive investment prospect. Specifically, we'll consider its Return On Capital Employed (ROCE), since that will give us an insight into how efficiently the business can generate profits from the capital it requires.
Firstly, we'll go over how we calculate ROCE. Next, we'll compare it to others in its industry. Last but not least, we'll look at what impact its current liabilities have on its ROCE.
Understanding Return On Capital Employed (ROCE)
ROCE is a metric for evaluating how much pre-tax income (in percentage terms) a company earns on the capital invested in its business. All else being equal, a better business will have a higher ROCE. In brief, it is a useful tool, but it is not without drawbacks. Author Edwin Whiting says to be careful when comparing the ROCE of different businesses, since 'No two businesses are exactly alike.'
So, How Do We Calculate ROCE?
Analysts use this formula to calculate return on capital employed:
Return on Capital Employed = Earnings Before Interest and Tax (EBIT) ÷ (Total Assets - Current Liabilities)
Or for K & P International Holdings:
0.012 = HK$3.6m ÷ (HK$426m - HK$128m) (Based on the trailing twelve months to December 2018.)
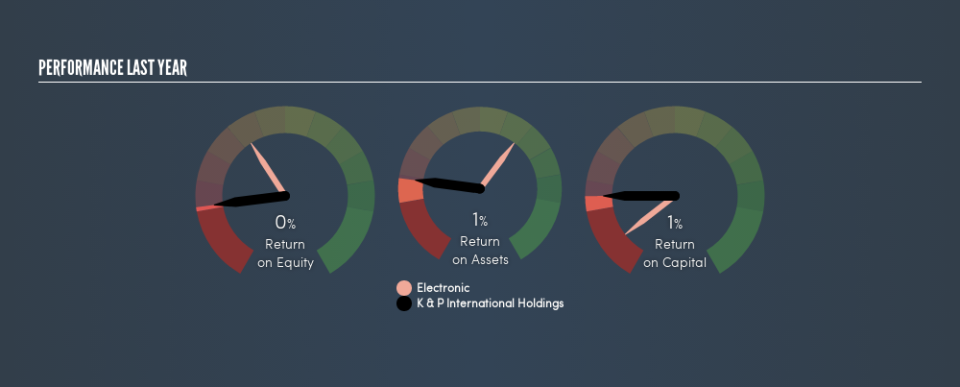
So, K & P International Holdings has an ROCE of 1.2%.
View our latest analysis for K & P International Holdings
Is K & P International Holdings's ROCE Good?
When making comparisons between similar businesses, investors may find ROCE useful. Using our data, K & P International Holdings's ROCE appears to be significantly below the 9.5% average in the Electronic industry. This performance could be negative if sustained, as it suggests the business may underperform its industry. Independently of how K & P International Holdings compares to its industry, its ROCE in absolute terms is low; especially compared to the ~2.0% available in government bonds. There are potentially more appealing investments elsewhere.
K & P International Holdings delivered an ROCE of 1.2%, which is better than 3 years ago, as was making losses back then. That suggests the business has returned to profitability. You can click on the image below to see (in greater detail) how K & P International Holdings's past growth compares to other companies.
It is important to remember that ROCE shows past performance, and is not necessarily predictive. Companies in cyclical industries can be difficult to understand using ROCE, as returns typically look high during boom times, and low during busts. ROCE is only a point-in-time measure. If K & P International Holdings is cyclical, it could make sense to check out this free graph of past earnings, revenue and cash flow.
How K & P International Holdings's Current Liabilities Impact Its ROCE
Current liabilities include invoices, such as supplier payments, short-term debt, or a tax bill, that need to be paid within 12 months. Due to the way ROCE is calculated, a high level of current liabilities makes a company look as though it has less capital employed, and thus can (sometimes unfairly) boost the ROCE. To check the impact of this, we calculate if a company has high current liabilities relative to its total assets.
K & P International Holdings has total assets of HK$426m and current liabilities of HK$128m. As a result, its current liabilities are equal to approximately 30% of its total assets. In light of sufficient current liabilities to noticeably boost the ROCE, K & P International Holdings's ROCE is concerning.
Our Take On K & P International Holdings's ROCE
This company may not be the most attractive investment prospect. But note: make sure you look for a great company, not just the first idea you come across. So take a peek at this free list of interesting companies with strong recent earnings growth (and a P/E ratio below 20).
For those who like to find winning investments this free list of growing companies with recent insider purchasing, could be just the ticket.
We aim to bring you long-term focused research analysis driven by fundamental data. Note that our analysis may not factor in the latest price-sensitive company announcements or qualitative material.
If you spot an error that warrants correction, please contact the editor at editorial-team@simplywallst.com. This article by Simply Wall St is general in nature. It does not constitute a recommendation to buy or sell any stock, and does not take account of your objectives, or your financial situation. Simply Wall St has no position in the stocks mentioned. Thank you for reading.