
Examining China Saite Group Company Limited’s (HKG:153) Weak Return On Capital Employed

Today we'll look at China Saite Group Company Limited (HKG:153) and reflect on its potential as an investment. Specifically, we're going to calculate its Return On Capital Employed (ROCE), in the hopes of getting some insight into the business.
First, we'll go over how we calculate ROCE. Then we'll compare its ROCE to similar companies. Then we'll determine how its current liabilities are affecting its ROCE.
Understanding Return On Capital Employed (ROCE)
ROCE measures the amount of pre-tax profits a company can generate from the capital employed in its business. All else being equal, a better business will have a higher ROCE. Overall, it is a valuable metric that has its flaws. Renowned investment researcher Michael Mauboussin has suggested that a high ROCE can indicate that 'one dollar invested in the company generates value of more than one dollar'.
So, How Do We Calculate ROCE?
The formula for calculating the return on capital employed is:
Return on Capital Employed = Earnings Before Interest and Tax (EBIT) ÷ (Total Assets - Current Liabilities)
Or for China Saite Group:
0.082 = CN¥264m ÷ (CN¥3.8b - CN¥535m) (Based on the trailing twelve months to June 2019.)
So, China Saite Group has an ROCE of 8.2%.
See our latest analysis for China Saite Group
Is China Saite Group's ROCE Good?
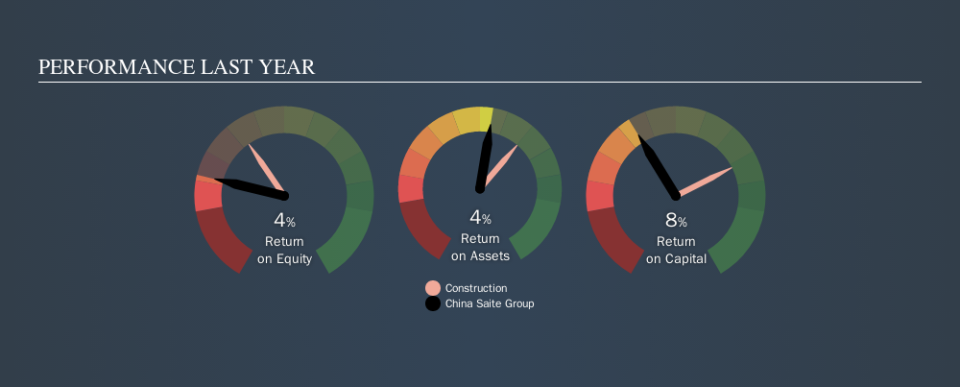
ROCE can be useful when making comparisons, such as between similar companies. We can see China Saite Group's ROCE is meaningfully below the Construction industry average of 12%. This could be seen as a negative, as it suggests some competitors may be employing their capital more efficiently. Separate from how China Saite Group stacks up against its industry, its ROCE in absolute terms is mediocre; relative to the returns on government bonds. It is possible that there are more rewarding investments out there.
China Saite Group's current ROCE of 8.2% is lower than its ROCE in the past, which was 20%, 3 years ago. So investors might consider if it has had issues recently. The image below shows how China Saite Group's ROCE compares to its industry, and you can click it to see more detail on its past growth.
When considering this metric, keep in mind that it is backwards looking, and not necessarily predictive. Companies in cyclical industries can be difficult to understand using ROCE, as returns typically look high during boom times, and low during busts. This is because ROCE only looks at one year, instead of considering returns across a whole cycle. How cyclical is China Saite Group? You can see for yourself by looking at this free graph of past earnings, revenue and cash flow.
Do China Saite Group's Current Liabilities Skew Its ROCE?
Current liabilities are short term bills and invoices that need to be paid in 12 months or less. Due to the way ROCE is calculated, a high level of current liabilities makes a company look as though it has less capital employed, and thus can (sometimes unfairly) boost the ROCE. To counteract this, we check if a company has high current liabilities, relative to its total assets.
China Saite Group has total liabilities of CN¥535m and total assets of CN¥3.8b. As a result, its current liabilities are equal to approximately 14% of its total assets. This is a modest level of current liabilities, which would only have a small effect on ROCE.
What We Can Learn From China Saite Group's ROCE
With that in mind, we're not overly impressed with China Saite Group's ROCE, so it may not be the most appealing prospect. You might be able to find a better investment than China Saite Group. If you want a selection of possible winners, check out this free list of interesting companies that trade on a P/E below 20 (but have proven they can grow earnings).
I will like China Saite Group better if I see some big insider buys. While we wait, check out this free list of growing companies with considerable, recent, insider buying.
We aim to bring you long-term focused research analysis driven by fundamental data. Note that our analysis may not factor in the latest price-sensitive company announcements or qualitative material.
If you spot an error that warrants correction, please contact the editor at editorial-team@simplywallst.com. This article by Simply Wall St is general in nature. It does not constitute a recommendation to buy or sell any stock, and does not take account of your objectives, or your financial situation. Simply Wall St has no position in the stocks mentioned. Thank you for reading.