
DOGE and SHIB Look to Consolidate Sunday’s Gains
Key Insights:
It was a bullish session for DOGE and SHIB on Sunday.
DOGE and SHIB ended the week in positive territory.
Key technical indicators remain bullish, with DOGE and SHIB holding above the 50-day EMAs.
It was a bullish day for DOGE and SHIB on Sunday.
On a bullish crypto session, DOGE and SHIB recovered from early losses to wrap up the week in positive territory.
Reversing a 1.77% fall from Saturday, DOGE rallied by 5.55% on Sunday to end the day at $0.1465. SHIB reversed a 1.22% fall with a 3.83% gain to end the day at $0.00002682.
Elsewhere, LUNA slipped by 1.67%, bucking the broader crypto market trend.
BNB (+2.95%) and SOL (+3.31%) led the top 10 cryptos.
AVAX (+2.05%), ADA (+2.60%), ETH (+2.25%), and XRP (+2.36%) also found support to join BTC (+1.24%), DOGE, and SHIB in positive territory.
DOGE and SHIB Rally Despite a Quiet Day on the Crypto News Wires
It was a quiet day on the crypto news wires, leaving the technical indicators to provide DOGE and SHIB with price direction.
Early afternoon moves through the day’s pivot levels supported a run at the day’s key resistance levels. The early afternoon rally also saw DOGE and SHIB break through their 50-day EMAs, which was price positive.
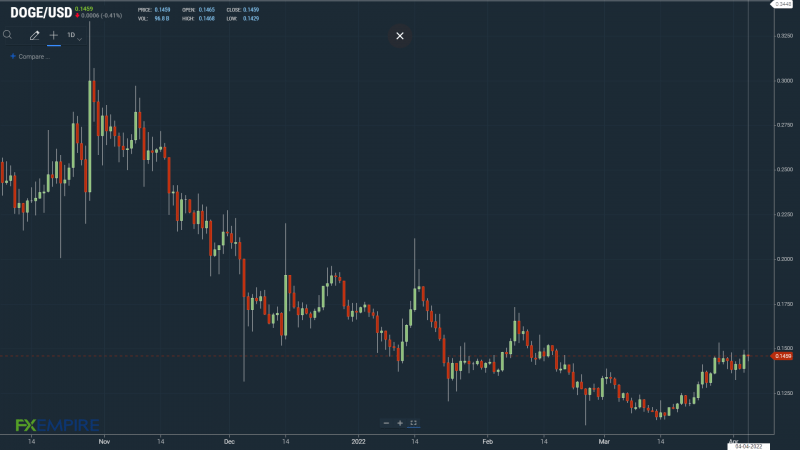
DOGE Price Action
At the time of writing, DOGE was down 0.41% to $0.1459. A mixed start to the day saw DOGE fall to an early morning low of $0.1429 before finding support.
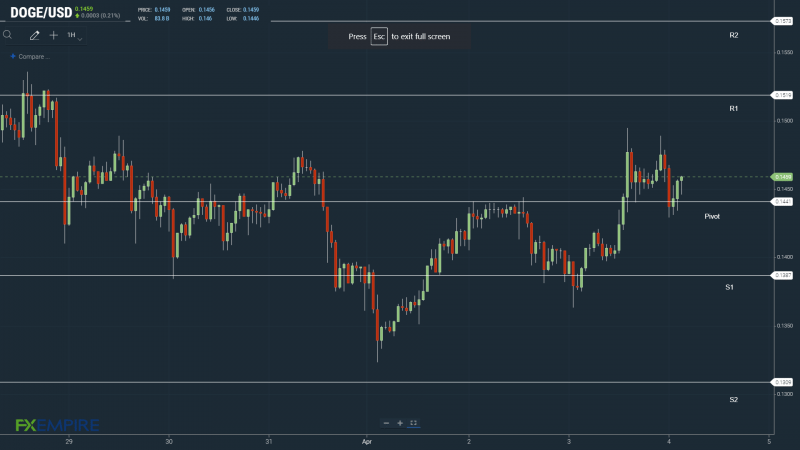
Technical Indicators
DOGE will need to avoid the day’s $0.1441 pivot to make a run on the First Major Resistance Level at $0.1519. DOGE would need the broader crypto market to support a move through the Sunday high of $0.1495.
An extended rally would test the Second Major Resistance Level at $0.1573 and resistance at $0.16. The Third Major Resistance Level sits at $0.1705.
A fall through the pivot would test the First Major Support Level at $0.1387. Barring an extended sell-off, DOGE should steer clear of sub-$0.1350 levels. The Second Major Support Level sits at $0.1309.
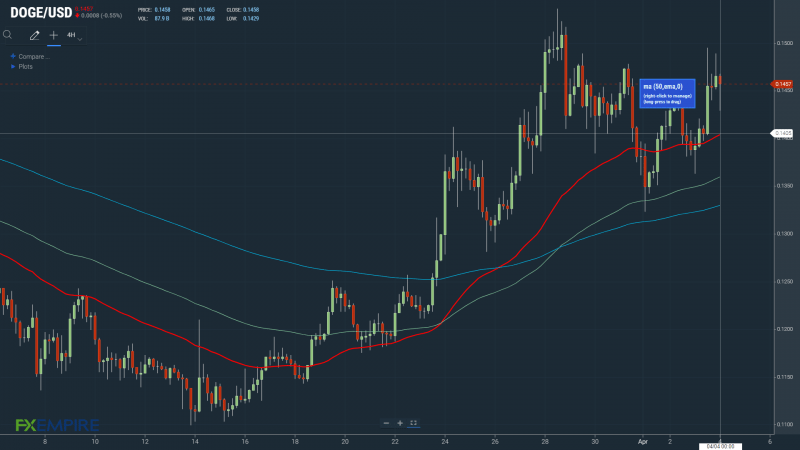
Looking at the EMAs and the 4-hourly candlestick chart (below), it is a bullish signal. DOGE sits above the 50-day EMA, currently at $0.1405. This morning, 50-day EMA pulled away from the 100-day EMA. The 100-day EMA pulled away from the 200-day EMA after last week’s bullish cross; DOGE positive.
Holding above the 50-day EMA would support a move back through to $0.16.
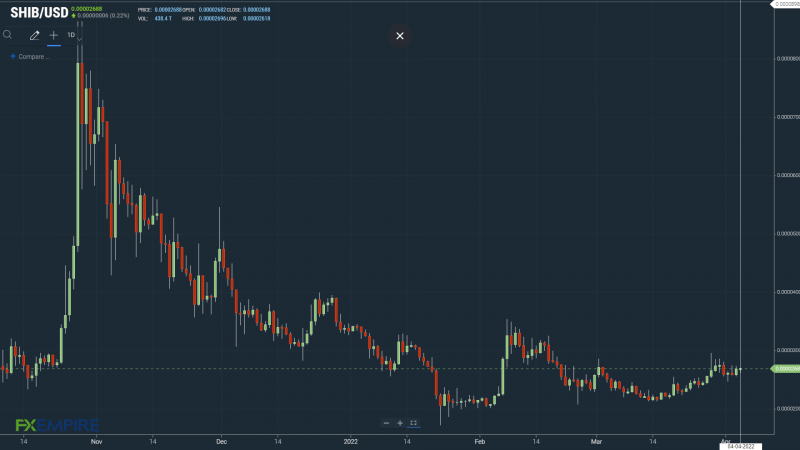
SHIB Price Action
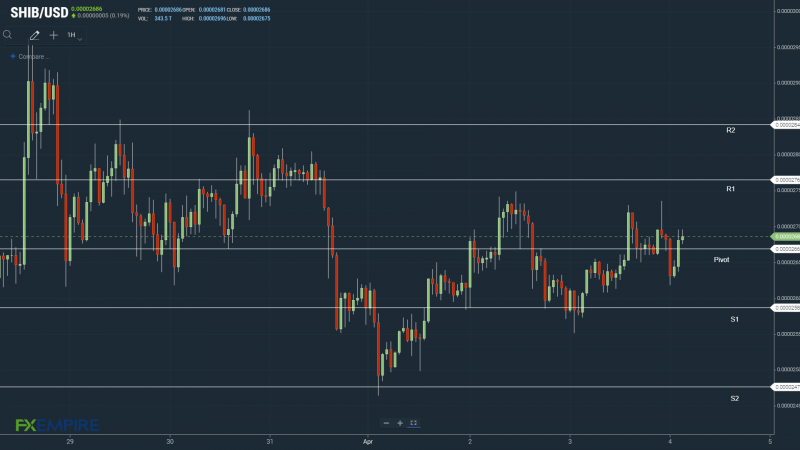
At the time of writing, SHIB was up by 0.22% to $0.00002682. A mixed start to the day saw SHIB fall to an early morning low of $0.00002618 before making a move.
Technical Indicators
SHIB will need to avoid the day’s $0.0000266 pivot to make a run on the First Major Resistance Level at $0.0000276. SHIB would need the broader crypto market to break out from the Sunday high of $0.00002736.
An extended rally would test the Second Major Resistance Level at $0.0000284 and resistance at $0.000029. The Third Major Resistance Level sits at $0.0000303.
A fall through the pivot would bring the First Major Support Level at $0.0000258 into play. Barring an extended sell-off, SHIB should steer clear of sub-$0.000025 levels. The Second Major Support Level sits at $0.0000247.
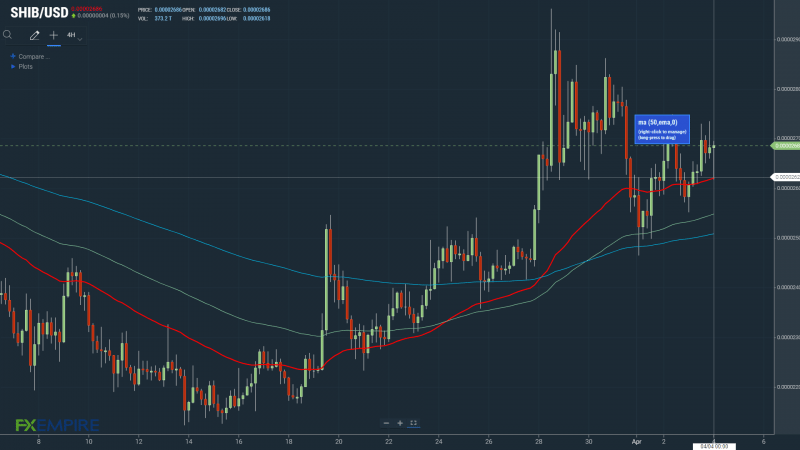
Looking at the EMAs and the 4-hourly candlestick chart (below), it is a bullish signal. SHIB sits above the 50-day EMA at $0.0000262. This morning, the 50-day EMA widened from the 100-day EMA. The 100-day EMA pulled away from the 200-day EMA after last week’s bullish cross.
Holding above the 50-day EMA would bring $0.000030 levels into play.
This article was originally posted on FX Empire