
Does Xero Limited’s (ASX:XRO) Earnings Growth Make It An Outperformer?

Examining Xero Limited’s (ASX:XRO) past track record of performance is a useful exercise for investors. It allows us to reflect on whether the company has met or exceed expectations, which is a powerful signal for future performance. Below, I will assess XRO’s latest performance announced on 30 September 2017 and weight these figures against its longer term trend and industry movements. Check out our latest analysis for Xero
Could XRO beat the long-term trend and outperform its industry?
I use data from the most recent 12 months, which annualizes the most recent half-year data, or in some cases, the latest annual report is already the most recent financial year data. This method allows me to examine different stocks on a more comparable basis, using new information. For Xero, its most recent earnings (trailing twelve month) is -NZ$46.22M, which, in comparison to the prior year’s figure, has become less negative. Given that these figures may be somewhat myopic, I have estimated an annualized five-year figure for Xero’s net income, which stands at -NZ$42.56M. This suggests that, Xero has historically performed better than recently, even though it seems like earnings are now heading back towards a more favorable position once more.
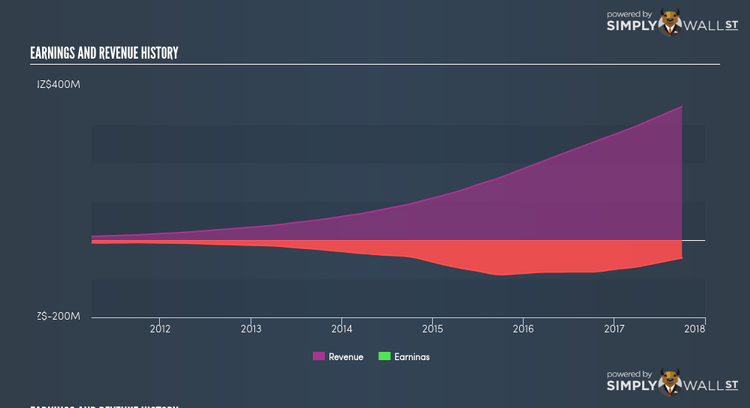
We can further evaluate Xero’s loss by looking at what the industry has been experiencing over the past few years. Each year, for the past half a decade Xero’s top-line has grown by 42.57% on average, implying that the company is in a high-growth period with expenses racing ahead revenues, leading to annual losses. Looking at growth from a sector-level, the Australian software industry has been growing its average earnings by double-digit 13.49% in the previous twelve months, and 15.31% over the past five years. This suggests that, despite the fact that Xero is currently running a loss, it may have gained from industry tailwinds, moving earnings into a more favorable position.
What does this mean?
Though Xero’s past data is helpful, it is only one aspect of my investment thesis. With companies that are currently loss-making, it is always difficult to forecast what will occur going forward, and when. The most useful step is to assess company-specific issues Xero may be facing and whether management guidance has regularly been met in the past. I recommend you continue to research Xero to get a more holistic view of the stock by looking at:
1. Future Outlook: What are well-informed industry analysts predicting for XRO’s future growth? Take a look at our free research report of analyst consensus for XRO’s outlook.
2. Financial Health: Is XRO’s operations financially sustainable? Balance sheets can be hard to analyze, which is why we’ve done it for you. Check out our financial health checks here.
3. Other High-Performing Stocks: Are there other stocks that provide better prospects with proven track records? Explore our free list of these great stocks here.
NB: Figures in this article are calculated using data from the trailing twelve months from 30 September 2017. This may not be consistent with full year annual report figures.
To help readers see pass the short term volatility of the financial market, we aim to bring you a long-term focused research analysis purely driven by fundamental data. Note that our analysis does not factor in the latest price sensitive company announcements.
The author is an independent contributor and at the time of publication had no position in the stocks mentioned.