
Does IGO (ASX:IGO) Have A Healthy Balance Sheet?

Warren Buffett famously said, 'Volatility is far from synonymous with risk.' So it might be obvious that you need to consider debt, when you think about how risky any given stock is, because too much debt can sink a company. We note that IGO Limited (ASX:IGO) does have debt on its balance sheet. But the more important question is: how much risk is that debt creating?
Why Does Debt Bring Risk?
Debt assists a business until the business has trouble paying it off, either with new capital or with free cash flow. Part and parcel of capitalism is the process of 'creative destruction' where failed businesses are mercilessly liquidated by their bankers. However, a more frequent (but still costly) occurrence is where a company must issue shares at bargain-basement prices, permanently diluting shareholders, just to shore up its balance sheet. Of course, plenty of companies use debt to fund growth, without any negative consequences. When we examine debt levels, we first consider both cash and debt levels, together.
See our latest analysis for IGO
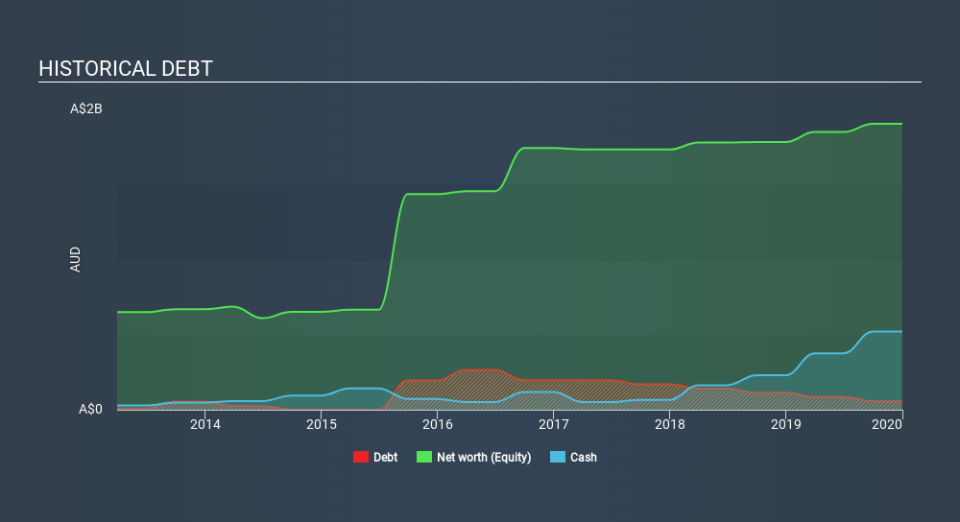
How Much Debt Does IGO Carry?
The image below, which you can click on for greater detail, shows that IGO had debt of AU$56.5m at the end of December 2019, a reduction from AU$112.7m over a year. However, it does have AU$521.3m in cash offsetting this, leading to net cash of AU$464.9m.
A Look At IGO's Liabilities
Zooming in on the latest balance sheet data, we can see that IGO had liabilities of AU$119.9m due within 12 months and liabilities of AU$224.1m due beyond that. On the other hand, it had cash of AU$521.3m and AU$30.3m worth of receivables due within a year. So it can boast AU$207.6m more liquid assets than total liabilities.
This short term liquidity is a sign that IGO could probably pay off its debt with ease, as its balance sheet is far from stretched. Simply put, the fact that IGO has more cash than debt is arguably a good indication that it can manage its debt safely.
Better yet, IGO grew its EBIT by 168% last year, which is an impressive improvement. That boost will make it even easier to pay down debt going forward. When analysing debt levels, the balance sheet is the obvious place to start. But it is future earnings, more than anything, that will determine IGO's ability to maintain a healthy balance sheet going forward. So if you want to see what the professionals think, you might find this free report on analyst profit forecasts to be interesting.
But our final consideration is also important, because a company cannot pay debt with paper profits; it needs cold hard cash. While IGO has net cash on its balance sheet, it's still worth taking a look at its ability to convert earnings before interest and tax (EBIT) to free cash flow, to help us understand how quickly it is building (or eroding) that cash balance. Over the last three years, IGO actually produced more free cash flow than EBIT. That sort of strong cash conversion gets us as excited as the crowd when the beat drops at a Daft Punk concert.
Summing up
While it is always sensible to investigate a company's debt, in this case IGO has AU$464.9m in net cash and a decent-looking balance sheet. And it impressed us with free cash flow of AU$370m, being 171% of its EBIT. So we don't think IGO's use of debt is risky. There's no doubt that we learn most about debt from the balance sheet. However, not all investment risk resides within the balance sheet - far from it. Be aware that IGO is showing 2 warning signs in our investment analysis , you should know about...
If you're interested in investing in businesses that can grow profits without the burden of debt, then check out this free list of growing businesses that have net cash on the balance sheet.
If you spot an error that warrants correction, please contact the editor at editorial-team@simplywallst.com. This article by Simply Wall St is general in nature. It does not constitute a recommendation to buy or sell any stock, and does not take account of your objectives, or your financial situation. Simply Wall St has no position in the stocks mentioned.
We aim to bring you long-term focused research analysis driven by fundamental data. Note that our analysis may not factor in the latest price-sensitive company announcements or qualitative material. Thank you for reading.