
How Do Yue Yuen Industrial (Holdings) Limited’s (HKG:551) Returns Compare To Its Industry?

Today we are going to look at Yue Yuen Industrial (Holdings) Limited (HKG:551) to see whether it might be an attractive investment prospect. Specifically, we're going to calculate its Return On Capital Employed (ROCE), in the hopes of getting some insight into the business.
First of all, we'll work out how to calculate ROCE. Second, we'll look at its ROCE compared to similar companies. And finally, we'll look at how its current liabilities are impacting its ROCE.
What is Return On Capital Employed (ROCE)?
ROCE is a metric for evaluating how much pre-tax income (in percentage terms) a company earns on the capital invested in its business. Generally speaking a higher ROCE is better. Ultimately, it is a useful but imperfect metric. Renowned investment researcher Michael Mauboussin has suggested that a high ROCE can indicate that 'one dollar invested in the company generates value of more than one dollar'.
So, How Do We Calculate ROCE?
Analysts use this formula to calculate return on capital employed:
Return on Capital Employed = Earnings Before Interest and Tax (EBIT) ÷ (Total Assets - Current Liabilities)
Or for Yue Yuen Industrial (Holdings):
0.064 = US$390m ÷ (US$8.3b - US$2.2b) (Based on the trailing twelve months to September 2019.)
So, Yue Yuen Industrial (Holdings) has an ROCE of 6.4%.
View our latest analysis for Yue Yuen Industrial (Holdings)
Is Yue Yuen Industrial (Holdings)'s ROCE Good?
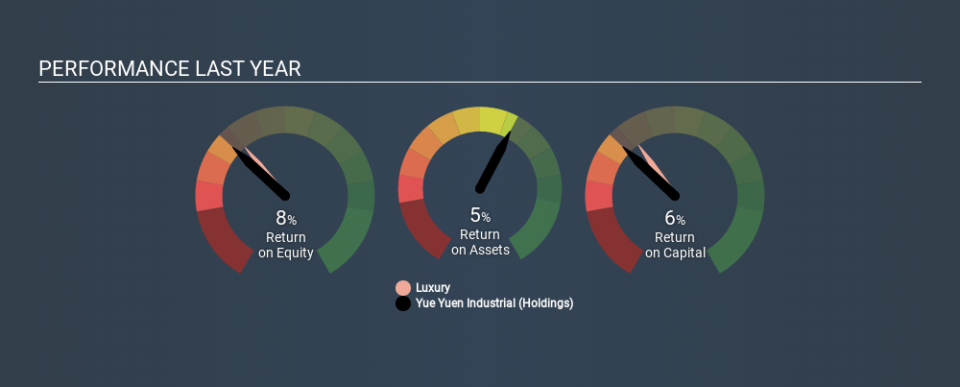
When making comparisons between similar businesses, investors may find ROCE useful. Using our data, Yue Yuen Industrial (Holdings)'s ROCE appears to be significantly below the 9.6% average in the Luxury industry. This could be seen as a negative, as it suggests some competitors may be employing their capital more efficiently. Setting aside the industry comparison for now, Yue Yuen Industrial (Holdings)'s ROCE is mediocre in absolute terms, considering the risk of investing in stocks versus the safety of a bank account. It is possible that there are more rewarding investments out there.
The image below shows how Yue Yuen Industrial (Holdings)'s ROCE compares to its industry, and you can click it to see more detail on its past growth.
When considering ROCE, bear in mind that it reflects the past and does not necessarily predict the future. ROCE can be misleading for companies in cyclical industries, with returns looking impressive during the boom times, but very weak during the busts. This is because ROCE only looks at one year, instead of considering returns across a whole cycle. Since the future is so important for investors, you should check out our free report on analyst forecasts for Yue Yuen Industrial (Holdings).
Yue Yuen Industrial (Holdings)'s Current Liabilities And Their Impact On Its ROCE
Short term (or current) liabilities, are things like supplier invoices, overdrafts, or tax bills that need to be paid within 12 months. The ROCE equation subtracts current liabilities from capital employed, so a company with a lot of current liabilities appears to have less capital employed, and a higher ROCE than otherwise. To counter this, investors can check if a company has high current liabilities relative to total assets.
Yue Yuen Industrial (Holdings) has current liabilities of US$2.2b and total assets of US$8.3b. As a result, its current liabilities are equal to approximately 27% of its total assets. It is good to see a restrained amount of current liabilities, as this limits the effect on ROCE.
The Bottom Line On Yue Yuen Industrial (Holdings)'s ROCE
If Yue Yuen Industrial (Holdings) continues to earn an uninspiring ROCE, there may be better places to invest. You might be able to find a better investment than Yue Yuen Industrial (Holdings). If you want a selection of possible winners, check out this free list of interesting companies that trade on a P/E below 20 (but have proven they can grow earnings).
If you like to buy stocks alongside management, then you might just love this free list of companies. (Hint: insiders have been buying them).
If you spot an error that warrants correction, please contact the editor at editorial-team@simplywallst.com. This article by Simply Wall St is general in nature. It does not constitute a recommendation to buy or sell any stock, and does not take account of your objectives, or your financial situation. Simply Wall St has no position in the stocks mentioned.
We aim to bring you long-term focused research analysis driven by fundamental data. Note that our analysis may not factor in the latest price-sensitive company announcements or qualitative material. Thank you for reading.