
Should You Like Trigiant Group Limited’s (HKG:1300) High Return On Capital Employed?

Today we'll look at Trigiant Group Limited (HKG:1300) and reflect on its potential as an investment. To be precise, we'll consider its Return On Capital Employed (ROCE), as that will inform our view of the quality of the business.
Firstly, we'll go over how we calculate ROCE. Next, we'll compare it to others in its industry. And finally, we'll look at how its current liabilities are impacting its ROCE.
Return On Capital Employed (ROCE): What is it?
ROCE measures the 'return' (pre-tax profit) a company generates from capital employed in its business. Generally speaking a higher ROCE is better. Ultimately, it is a useful but imperfect metric. Renowned investment researcher Michael Mauboussin has suggested that a high ROCE can indicate that 'one dollar invested in the company generates value of more than one dollar'.
How Do You Calculate Return On Capital Employed?
The formula for calculating the return on capital employed is:
Return on Capital Employed = Earnings Before Interest and Tax (EBIT) ÷ (Total Assets - Current Liabilities)
Or for Trigiant Group:
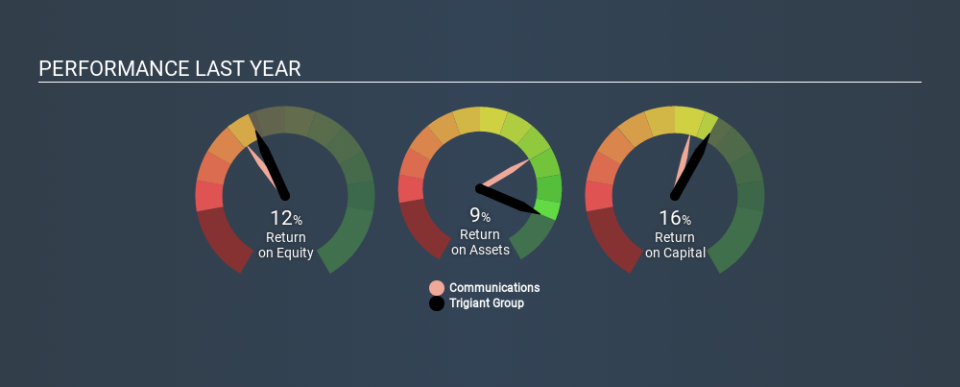
0.16 = CN¥538m ÷ (CN¥5.4b - CN¥2.0b) (Based on the trailing twelve months to June 2019.)
Therefore, Trigiant Group has an ROCE of 16%.
See our latest analysis for Trigiant Group
Is Trigiant Group's ROCE Good?
ROCE is commonly used for comparing the performance of similar businesses. Using our data, we find that Trigiant Group's ROCE is meaningfully better than the 9.0% average in the Communications industry. We consider this a positive sign, because it suggests it uses capital more efficiently than similar companies. Regardless of where Trigiant Group sits next to its industry, its ROCE in absolute terms appears satisfactory, and this company could be worth a closer look.
You can see in the image below how Trigiant Group's ROCE compares to its industry. Click to see more on past growth.
Remember that this metric is backwards looking - it shows what has happened in the past, and does not accurately predict the future. ROCE can be misleading for companies in cyclical industries, with returns looking impressive during the boom times, but very weak during the busts. ROCE is, after all, simply a snap shot of a single year. Since the future is so important for investors, you should check out our free report on analyst forecasts for Trigiant Group.
Trigiant Group's Current Liabilities And Their Impact On Its ROCE
Current liabilities are short term bills and invoices that need to be paid in 12 months or less. The ROCE equation subtracts current liabilities from capital employed, so a company with a lot of current liabilities appears to have less capital employed, and a higher ROCE than otherwise. To check the impact of this, we calculate if a company has high current liabilities relative to its total assets.
Trigiant Group has total liabilities of CN¥2.0b and total assets of CN¥5.4b. As a result, its current liabilities are equal to approximately 36% of its total assets. Trigiant Group has a middling amount of current liabilities, increasing its ROCE somewhat.
The Bottom Line On Trigiant Group's ROCE
While its ROCE looks good, it's worth remembering that the current liabilities are making the business look better. There might be better investments than Trigiant Group out there, but you will have to work hard to find them . These promising businesses with rapidly growing earnings might be right up your alley.
For those who like to find winning investments this free list of growing companies with recent insider purchasing, could be just the ticket.
If you spot an error that warrants correction, please contact the editor at editorial-team@simplywallst.com. This article by Simply Wall St is general in nature. It does not constitute a recommendation to buy or sell any stock, and does not take account of your objectives, or your financial situation. Simply Wall St has no position in the stocks mentioned.
We aim to bring you long-term focused research analysis driven by fundamental data. Note that our analysis may not factor in the latest price-sensitive company announcements or qualitative material. Thank you for reading.