
S&P 500 Turns to 1800 as Key Support Holds
On the back of hope and confirmation that emerging markets are implementing policies to protect their currencies from the impact of the Federal Reserve’s reduction of QE3, risk assets (for example: stock markets, high yielding currencies) rallied on Wednesday. The S&P 500 has rebounded ahead of key support as a result.
Emerging market economies have been under pressure the past several weeks as 2014 has sung a different tune than 2013. Investors have started to show real concern that the Federal Reserve’s plans to end its QE3 bond-buying program will have a negative impact on riskier assets. However, on the back of a significantly stronger Turkish Lira – thanks to a surprise 5% rate hike by the Turkish central bank – traders may find that there is one less reason to be pessimistic.
The S&P 500 turned higher back to 1791.50 for a gain of +1.17% on Tuesday. After news broke of the emergency rate hike, investors became even more relieved of recent emerging market stress, with the S&P 500 climbing by another +0.50% to 1801.50 after hours. The rate hike has been interpreted (so far) as a sign that even the more vulnerable emerging markets are willing to take serious action to deal with the impact of the Federal Reserve’s taper efforts.
Forex Technical Analysis: S&P 500 (SPX500) Chart (Daily)
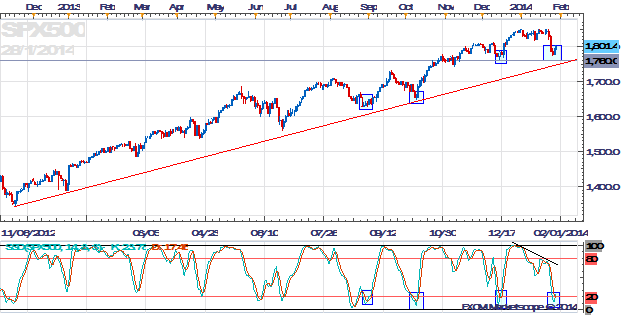
The S&P 500 has turned higher to continue its series of higher highs and higher lows going back to November 2012. The January low has been set a higher level than the December low, and the 1760 which has previously served as a magnet for price held as support.
We have previously pointed out on the chart there are various blue boxes highlighting important lows in the S&P 500. An important observation was that the S&P 500 rallied on each Slow Stochastic “buy” signal before a new “low” relative to the last signal was set. Yesterday a “buy” signal was given.
Should traders be worried about the FOMC meeting for the S&P 500?
In forex trading, just like in any other financial asset class, past performance is not indicative of future performance. Technicians use the history of price to reveal patterns about how investors feel about a given instrument. The “buy” signal given has occurred in the same pattern as the three previous “buy” signals emerging from oversold territory: as price sets a higher high relative to the previous “buy” signal in the Slow Stochastics indicator.
If the uptrend the S&P 500 has seen is to continue, then price and the indicator should continue to march to the same beat. Or, ahead of the Federal Reserve’s meeting on Wednesday, the S&P 500 might have made what could be the next swing low in the year-plus rally. Traders can monitor this pattern going forward because if 1760 breaks, then the pattern has changed and there would be evidence that the rally would be changing.
The S&P 500 hasn’t seemed to mind whatever the Federal Reserve does. In September, when the Federal Reserve surprised traders by not tapering QE3, stock markets rallied. In December, when the Federal Reserve surprised traders by tapering QE3 by $10B to $75B per month, stock markets rallied. Fortunately, the technicals may be providing a clear level to define risk to S&P 500 bulls for the near future, at 1760.
DailyFX provides forex news and technical analysis on the trends that influence the global currency markets.
Learn forex trading with a free practice account and trading charts from FXCM.