
S&P 500 Nears Major Uptrend Support at 1760
US stocks have had a worse start to 2014 than most imagined. The Federal Reserve’s meeting on Wednesday arrives at a crossroads for the S&P 500.
US stock markets remained under pressure on Monday as fears of an emerging market crisis persisted. The -0.58% drop in the S&P 500 followed the worst weekly loss last week since June 2012. However, attention is slowly turning from Latin America, Central Asia, and Southeast Asia back to the United States as a big week of US events comes to pass.
On Tuesday, important consumption and confidence data will be released. On Thursday, the fourth quarter GDP report will be released. All are expected to show that the US economy remains stronger than it did a few months ago and stronger than it was a year ago. But nothing will be as important to traders (and the S&P 500) than the Federal Reserve’s meeting on Wednesday.
What do economists think about the Federal Reserve’s meeting?
The Federal Reserve will taper its QE3 bond-buying program to $65B per month from $75B per month, according to consensus estimates compiled by Bloomberg News. There will be an equal $5B in cuts to each half of the program, Treasuries purchases and mortgage-backed securities (MBS) purchases. The impact of the Federal Reserve’s taper agenda on markets has been hazy at best.
On December 18, 2013, after the Federal Reserve announced its first taper of QE3 by $10B, from $85B per month, US stock markets rallied – even though the taper announcement was unexpected (consensus forecasts compiled by Bloomberg News saw no change in policy). Now US stocks are at a key level of support that will be influenced by this week’s events.
Forex Technical Analysis: S&P 500 (SPX500) Chart (Daily)
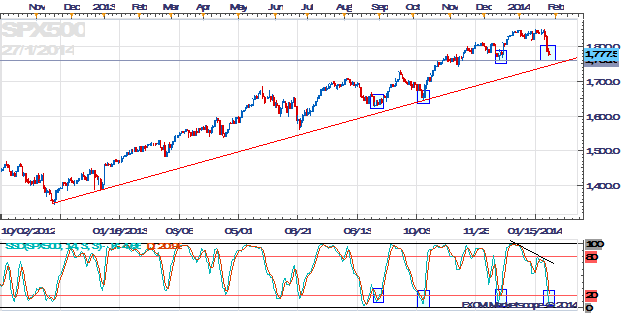
The S&P 500 has continuously traded to a series of higher highs and higher lows going back to November 2012, in what has become a very apparent uptrend. The recent attempt at new highs in January, however, was met with sharper-than-usual selling on the pullback. Relative to price, the Slow Stochastics indicator has created a series of lower highs, which has created divergence.
The 1760 level in the S&P 500 should be critical the next several days. In early November, it contained price in both directions before the longer-term uptrend attracted more buyers for the next wave up. It also served as a support level on a retest at the turn of 2013/2014.
The Slow Stochastics indicator will be important to watch as it enters oversold territory, especially as the index approaches 1760. Failure to hold 1760 with the indicator sustaining a move in oversold territory would be suggestive of a near-term top potentially. Why do we say this?
On the chart there are various blue boxes highlighting important lows in the S&P 500. The blue boxes also highlight turns in the Slow Stochastic indicator. We see that the past three “buy” signals generated when the S&P 500 was holding above the red line (the rising trendline going back to November 2012) led to a rally that produced new highs. Also, the S&P 500 rallied on each “buy” signal before a new “low” relative to the last signal was set.
In other words, if the S&P 500’s uptrend is to continue, it will be important to see the Slow Stochastics indicator turn higher ahead, out of oversold territory, before price falls below 1760. If not, then a change in the relationship between price and the indicator is changing, perhaps warning of a bigger change in trend developing.
DailyFX provides forex news and technical analysis on the trends that influence the global currency markets.
Learn forex trading with a free practice account and trading charts from FXCM.