
Don't Sell Tingyi (Cayman Islands) Holding Corp. (HKG:322) Before You Read This

Want to participate in a short research study? Help shape the future of investing tools and you could win a $250 gift card!
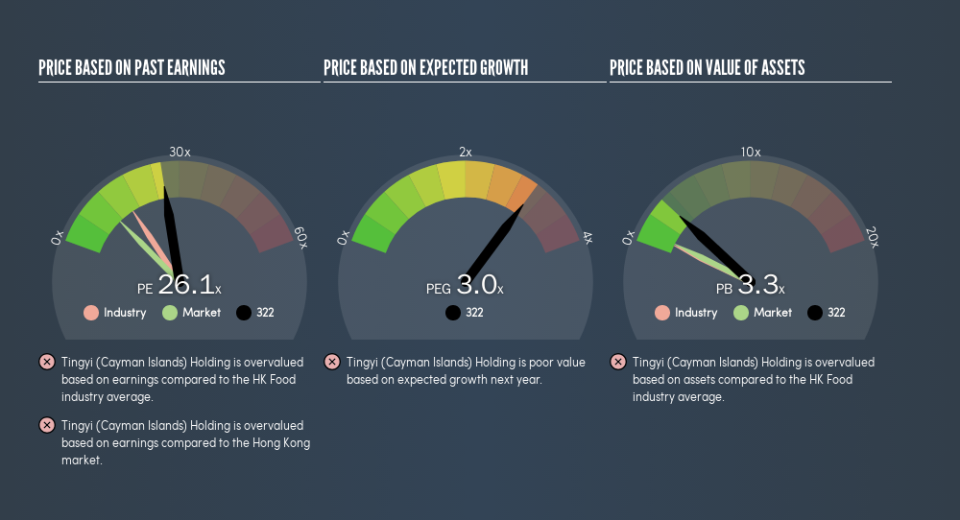
Today, we'll introduce the concept of the P/E ratio for those who are learning about investing. We'll apply a basic P/E ratio analysis to Tingyi (Cayman Islands) Holding Corp.'s (HKG:322), to help you decide if the stock is worth further research. Tingyi (Cayman Islands) Holding has a price to earnings ratio of 26.14, based on the last twelve months. In other words, at today's prices, investors are paying HK$26.14 for every HK$1 in prior year profit.
View our latest analysis for Tingyi (Cayman Islands) Holding
How Do I Calculate Tingyi (Cayman Islands) Holding's Price To Earnings Ratio?
The formula for P/E is:
Price to Earnings Ratio = Price per Share (in the reporting currency) ÷ Earnings per Share (EPS)
Or for Tingyi (Cayman Islands) Holding:
P/E of 26.14 = CN¥11.46 (Note: this is the share price in the reporting currency, namely, CNY ) ÷ CN¥0.44 (Based on the year to December 2018.)
Is A High Price-to-Earnings Ratio Good?
A higher P/E ratio implies that investors pay a higher price for the earning power of the business. That is not a good or a bad thing per se, but a high P/E does imply buyers are optimistic about the future.
How Growth Rates Impact P/E Ratios
Earnings growth rates have a big influence on P/E ratios. Earnings growth means that in the future the 'E' will be higher. And in that case, the P/E ratio itself will drop rather quickly. A lower P/E should indicate the stock is cheap relative to others -- and that may attract buyers.
Notably, Tingyi (Cayman Islands) Holding grew EPS by a whopping 35% in the last year. And its annual EPS growth rate over 3 years is 14%. I'd therefore be a little surprised if its P/E ratio was not relatively high.
How Does Tingyi (Cayman Islands) Holding's P/E Ratio Compare To Its Peers?
The P/E ratio indicates whether the market has higher or lower expectations of a company. As you can see below, Tingyi (Cayman Islands) Holding has a higher P/E than the average company (15.8) in the food industry.
That means that the market expects Tingyi (Cayman Islands) Holding will outperform other companies in its industry. The market is optimistic about the future, but that doesn't guarantee future growth. So investors should delve deeper. I like to check if company insiders have been buying or selling.
Don't Forget: The P/E Does Not Account For Debt or Bank Deposits
The 'Price' in P/E reflects the market capitalization of the company. So it won't reflect the advantage of cash, or disadvantage of debt. Hypothetically, a company could reduce its future P/E ratio by spending its cash (or taking on debt) to achieve higher earnings.
While growth expenditure doesn't always pay off, the point is that it is a good option to have; but one that the P/E ratio ignores.
Is Debt Impacting Tingyi (Cayman Islands) Holding's P/E?
Since Tingyi (Cayman Islands) Holding holds net cash of CN¥3.0b, it can spend on growth, justifying a higher P/E ratio than otherwise.
The Verdict On Tingyi (Cayman Islands) Holding's P/E Ratio
Tingyi (Cayman Islands) Holding trades on a P/E ratio of 26.1, which is above the HK market average of 11. The excess cash it carries is the gravy on top its fast EPS growth. So based on this analysis we'd expect Tingyi (Cayman Islands) Holding to have a high P/E ratio.
Investors should be looking to buy stocks that the market is wrong about. If the reality for a company is better than it expects, you can make money by buying and holding for the long term. So this free visualization of the analyst consensus on future earnings could help you make the right decision about whether to buy, sell, or hold.
You might be able to find a better buy than Tingyi (Cayman Islands) Holding. If you want a selection of possible winners, check out this free list of interesting companies that trade on a P/E below 20 (but have proven they can grow earnings).
We aim to bring you long-term focused research analysis driven by fundamental data. Note that our analysis may not factor in the latest price-sensitive company announcements or qualitative material.
If you spot an error that warrants correction, please contact the editor at editorial-team@simplywallst.com. This article by Simply Wall St is general in nature. It does not constitute a recommendation to buy or sell any stock, and does not take account of your objectives, or your financial situation. Simply Wall St has no position in the stocks mentioned. Thank you for reading.