
Declining Stock and Decent Financials: Is The Market Wrong About Coventry Group Ltd (ASX:CYG)?
With its stock down 6.4% over the past month, it is easy to disregard Coventry Group (ASX:CYG). However, stock prices are usually driven by a company’s financials over the long term, which in this case look pretty respectable. Specifically, we decided to study Coventry Group's ROE in this article.
Return on Equity or ROE is a test of how effectively a company is growing its value and managing investors’ money. In short, ROE shows the profit each dollar generates with respect to its shareholder investments.
View our latest analysis for Coventry Group
How Is ROE Calculated?
The formula for ROE is:
Return on Equity = Net Profit (from continuing operations) ÷ Shareholders' Equity
So, based on the above formula, the ROE for Coventry Group is:
4.3% = AU$4.8m ÷ AU$114m (Based on the trailing twelve months to June 2022).
The 'return' is the profit over the last twelve months. Another way to think of that is that for every A$1 worth of equity, the company was able to earn A$0.04 in profit.
Why Is ROE Important For Earnings Growth?
Thus far, we have learned that ROE measures how efficiently a company is generating its profits. We now need to evaluate how much profit the company reinvests or "retains" for future growth which then gives us an idea about the growth potential of the company. Assuming everything else remains unchanged, the higher the ROE and profit retention, the higher the growth rate of a company compared to companies that don't necessarily bear these characteristics.
A Side By Side comparison of Coventry Group's Earnings Growth And 4.3% ROE
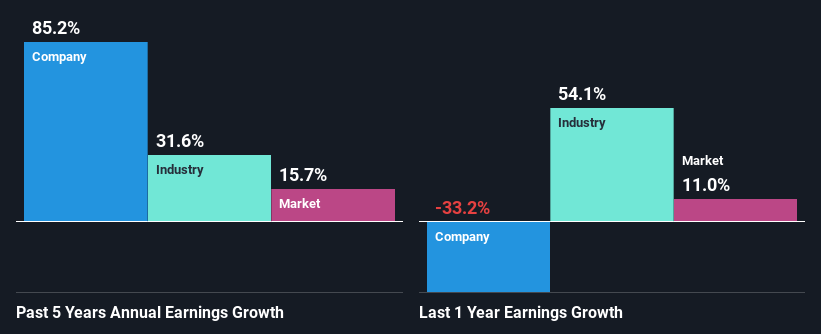
When you first look at it, Coventry Group's ROE doesn't look that attractive. Next, when compared to the average industry ROE of 11%, the company's ROE leaves us feeling even less enthusiastic. However, we we're pleasantly surprised to see that Coventry Group grew its net income at a significant rate of 85% in the last five years. We reckon that there could be other factors at play here. For example, it is possible that the company's management has made some good strategic decisions, or that the company has a low payout ratio.
We then compared Coventry Group's net income growth with the industry and we're pleased to see that the company's growth figure is higher when compared with the industry which has a growth rate of 32% in the same period.
Earnings growth is an important metric to consider when valuing a stock. What investors need to determine next is if the expected earnings growth, or the lack of it, is already built into the share price. This then helps them determine if the stock is placed for a bright or bleak future. If you're wondering about Coventry Group's's valuation, check out this gauge of its price-to-earnings ratio, as compared to its industry.
Is Coventry Group Making Efficient Use Of Its Profits?
Coventry Group's three-year median payout ratio is a pretty moderate 37%, meaning the company retains 63% of its income. So it seems that Coventry Group is reinvesting efficiently in a way that it sees impressive growth in its earnings (discussed above) and pays a dividend that's well covered.
Moreover, Coventry Group is determined to keep sharing its profits with shareholders which we infer from its long history of paying a dividend for at least ten years. Based on the latest analysts' estimates, we found that the company's future payout ratio over the next three years is expected to hold steady at 32%. Regardless, the future ROE for Coventry Group is predicted to rise to 9.6% despite there being not much change expected in its payout ratio.
Conclusion
Overall, we feel that Coventry Group certainly does have some positive factors to consider. Despite its low rate of return, the fact that the company reinvests a very high portion of its profits into its business, no doubt contributed to its high earnings growth. Having said that, the company's earnings growth is expected to slow down, as forecasted in the current analyst estimates. To know more about the latest analysts predictions for the company, check out this visualization of analyst forecasts for the company.
Have feedback on this article? Concerned about the content? Get in touch with us directly. Alternatively, email editorial-team (at) simplywallst.com.
This article by Simply Wall St is general in nature. We provide commentary based on historical data and analyst forecasts only using an unbiased methodology and our articles are not intended to be financial advice. It does not constitute a recommendation to buy or sell any stock, and does not take account of your objectives, or your financial situation. We aim to bring you long-term focused analysis driven by fundamental data. Note that our analysis may not factor in the latest price-sensitive company announcements or qualitative material. Simply Wall St has no position in any stocks mentioned.
Join A Paid User Research Session
You’ll receive a US$30 Amazon Gift card for 1 hour of your time while helping us build better investing tools for the individual investors like yourself. Sign up here