

In This Article:
A month has gone by since the last earnings report for JAKKS Pacific, Inc. JAKK. Shares have lost about 11.1% in that time frame.
Will the recent negative trend continue leading up to its next earnings release, or is JAKK due for a breakout? Before we dive into how investors and analysts have reacted as of late, let's take a quick look at its most recent earnings report in order to get a better handle on the important drivers.
Fourth Quarter 2017 Results
JAKKS Pacific reported lower-than-expected results in the fourth quarter of 2017.
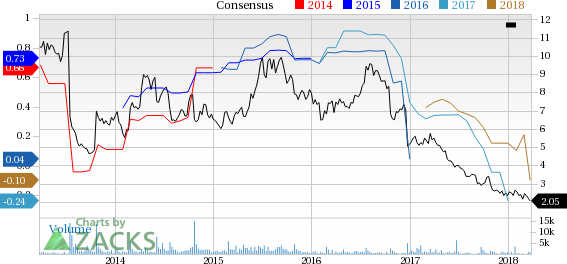
Adjusted loss of 61 cents per share was wider than the Zacks Consensus Estimate of a loss of 11 cents and the year-ago quarter’s loss of 47 cents.
Net sales in the fourth quarter totaled $136.6 million, lagging the consensus mark of $155.9 million by 12.4%. The top line also fell 18.2% year over year.
The challenging industry scenario for traditional toymakers have affected JAKKS Pacific’s results. Tighter retail inventory management and the recent Toys ‘R’ Us bankruptcy filing added to the woes.
Let’s delve deeper into the numbers.
Operating Highlights
Adjusted gross margin in the fourth quarter was 22.1%, down 910 basis points (bps) from the prior-year quarter. Gross margin was negatively impacted by minimum guarantee shortfalls, inventory impairment and the impact of low-margin sales in the quarter.
Operating costs in the quarter came in at $56.7 million. Adjusted EBITDA was negative $6.8 million against positive $4 million in the prior-year quarter.
Balance Sheet
As of Dec 31, 2017, cash and cash equivalents were nearly $65 million, compared with $86.1 million as of Dec 31, 2016. Net inventory decreased 22.5% year over year to $58.4 million in 2017.
Long-term debt in 2017 totaled $133.5 million, down from $203 million at the end of 2016.
Net cash from operating activities for the quarter was $17.2 million, compared with $37.4 million in the prior-year quarter.
2017 Results
For 2017, net sales came in at $613.1 million, down 13.2% from $706.6 million in 2016. Gross margin in the year was 25.4%, down 620 bps year over year.
Operating costs for 2017 were $219.8 million. Net loss totaled $3.89 per share, wider than earnings of 7 cents per share in 2016. Adjusted EBITDA in 2017 was $15.8 million, compared with adjusted EBITDA of positive $41.7 million in 2016.
The company expects sales to grow modestly in 2018 attributing to profits as the year passes.
How Have Estimates Been Moving Since Then?
In the past month, investors have witnessed a downward trend in fresh estimates. There have been two revisions lower for the current quarter.