
Watch These CrowdStrike Price Levels as Stock Continues Falling After Outage
Shares in the Cybersecurity Company Have Fallen 23% Over the Last Two Trading Sessions
Key Takeaways
CrowdStrike shares remain under pressure as investors assess the fallout from a software update by the cybersecurity company on Friday that caused widespread disruption at banks, airlines, broadcasters, and many other businesses.
The stock price first started showing signs of weakness last Thursday when it closed decisively beneath the 50-day moving average, before gapping sharply lower on Friday and closing below the 200-day MA on Monday.
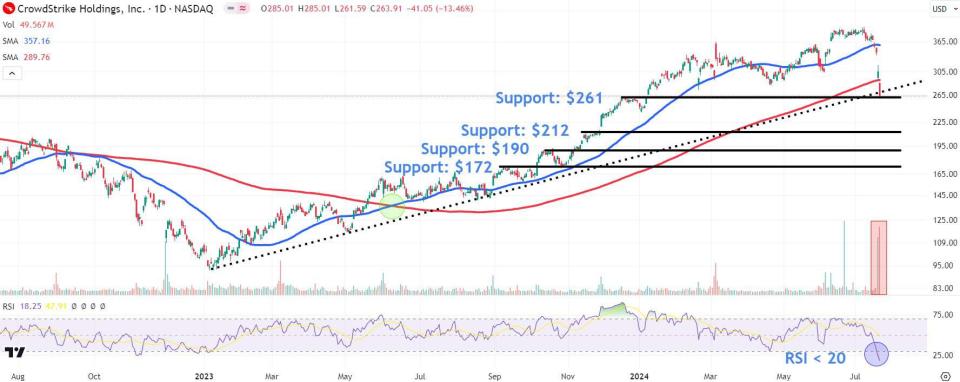
Amid further selling, investors should monitor key support levels on the chart at $261, $212, $190, and $172.
Shares in CrowdStrike (CRWD), the cybersecurity firm at the epicenter of Friday’s global tech outage, plunged more than 13% on Monday, as investors continue to assess the fallout from the software update that caused widespread disruption at banks, airlines, broadcasters, and many other businesses.
Amid the selling—the stock has lost 23% of its value over the last two sessions and has finished lower in five straight sessions—we take a closer look at the CrowdStrike chart and use technical analysis to point out important price levels where the stock may encounter support.
Stock Falls Below Key Moving Averages
Since bottoming out in January 2023, CrowdStrike shares have trended steadily higher, with momentum accelerating after the 50-day moving average (MA) crossed above the 200-day MA in June last year to generate a golden cross, a chart pattern that often marks the start of a new uptrend.
However, more recently, the cybersecurity giant’s stock price first started showing signs of weakness last Thursday when it closed decisively beneath the 50-day MA, with the shares then gapping sharply lower on Friday, as chaos erupted after the firm's software update mishap.
The selling has continued into this week, leading to a decisive close below the closely watched 200-day MA on Monday. Moreover, the outage-driven sell-off has occurred on significant trading volume, indicating conviction behind the move lower.
Levels to Monitor Amid Ongoing Selling
In the weeks ahead, it’s worth keeping an eye on these four important chart levels where the stock may attract buying interest if the shares continue to decline.
The first level sits at $261, just 1% below Monday’s close, where the stock may encounter a confluence of support from the December swing high and an uptrend line stretching back to the January 2023 low. This could also become an area for a short-term bounce, given the relative strength index (RSI) currently indicates deeply oversold conditions, with a reading below 20.
A breakdown below this area could spark a fall to around $212, a level on the chart where buyers could seek entry points near a period of consolidation preceding the late-November stock gap.
Ongoing weakness may see the shares revisit the $190 region, where they could attract support near a swing high that formed in October last year as part of the stock’s longer-term uptrend.
Finally, a deeper retracement could test lower support around $172 near a horizontal line linking a peak and trough on the chart between September and October last year.
The comments, opinions, and analyses expressed on Investopedia are for informational purposes only. Read our warranty and liability disclaimer for more info.
As of the date this article was written, the author does not own any of the above securities.
Read the original article on Investopedia.