
Royce Investment Partners: The Prospects for Extended Small-Cap Outperformance
What factors do you think helped the Russell 2000 Index to do so well in 3Q24 on bothan absolute and relative basis?
Francis Gannon:
I think it was a quintessential reversion to the mean event. Small-caps have been lagging larger companies for such an extended period that we weren't surprised to see the significant rebound for the Russell 2000. The small-cap index was up 9.3% versus a 6.1% gain for the large-cap Russell 1000 and a 4.2% advance for the mega-cap Russell Top 50. The third quarterwas therefore a long-awaited reversal in performance that we think has legs.
Chuck Royce (Trades, Portfolio):
I think what surprised me most was how compressed the small-cap gains were. All of the third quarter's positive return had been achieved by the sixteenth of July. That was the high for the quartera 10.6% advance from the end of June, and there was a substantial gain on that mid-July day. So, we saw a wonderful run through the first couple of weeks of 3Q24 followed by a steep downdraft. From July 16th though August 7th, the Russell 2000 fell -10.1% before recovering most of its gains through the end of September. Nonetheless, we were pleased with how small-caps did for the quarter. After all, the Russell 2000 last beatthe Russell 1000 in the fourth quarter of 2023, so we were encouraged by the third quarter's results
Are you concerned about the volatility within small-cap in 3Q24?
CR:
I'm not concerned about that for a couple of reasons. The first is that we always welcome volatility. While it can be painful in the short run, we always work to use volatility in stock prices to our long-term advantage. And as Joe Hintz recently pointed out when talking about technology stocks, we try to benefit from the market's gyrations on both the upsideby trimming positions whose prices have run up in the short run while patiently waiting for a longer-term investment thesis to play outand on the downside when prices fall to levels that we find attractive. The second reason is that large intra-year declines are really common. Over the last 25 years, that is, since 2000, the Russell 2000 has had a double-digit intra-year pullback in 22 of them. So, as long-tenured small-cap specialists, we know that volatility is part of the admission price of investing in the asset class.
What underlies your thinking in terms of how small-cap can sustain its nascent market leadership?
FG:
One trend that we've been watching is large-cap market breadthbecause broadening large-cap markets have historically been a positive developments for small-cap leadership. Admittedly, this may sound a bit counterintuitive, at least initially. However, our research shows that when the equal-weighted Russell 1000 outperformed the capitalization-weighted Russell 1000, small-caps generally led. We think this is logical in that small-caps usually had market leadership when positive performance was more evenly distributed throughout the market. The equal-weighted Russell 1000 and S&P 500 both made new highs as September came to a close, and we see this expansion of returns as a positive sign for small-cap's relative performance prospects.
How important is earnings growth for small-cap stocks going forward?
FG:
I would say they're crucial because earnings really are the building blocks of long-term performance. We often say that psychology runs the market in the short term, but earnings run it over the long term. So, while any number of factors can help sustain a short-term run for small-caps, we think consistent and/or increasing earnings are key in sustaining long-term outperformance. At the end of September, the Russell 2000 had a near-record number of companies with no earnings, a total of44.6%. Yet, earnings growth for those small-cap companies that have them is estimated to be higher than for large-cap businesses in 2025.
Small-Cap's Estimated Earnings Growth is Expected to Be Higher Than Large-Cap's in 2025
One-Year EPS Growth Earnings
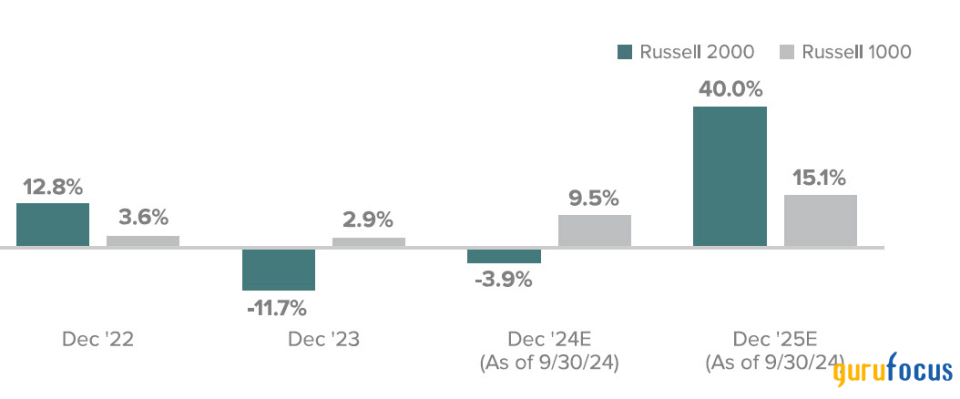
Earnings per share (EPS) is calculated as a company's profit divided by the outstanding shares of its common stock. The EPS Growth Estimates are the pre-calculated mean one-year EPS growth rate estimates by brokerage analysts. Estimates are the average of those provided by analysts working for brokerage fi rms who provide research coverage on each individual security as reported by FactSet. All non-equity securities, investment companies, companies without brokerage analyst coverage are excluded. Source: FactSet.
Why are consistent and/or high returns on invested capital (ROIC) such an important part of your analysis of small-cap companies?
CR:
We place a great deal of emphasis on company quality in a few of our major Strategies. You could say that ROIC is in our collective DNA in those portfolios because we've always seen it as foundational to any investment approach that puts a premium on company quality. Along with free cash flow, ROIC tells us a lot about management's skill at allocating capitalwhich is critical when looking for companies that can compound value over time. Small-cap companies with consistent, or consistently high, ROIC are usually in relatively short supply, so populating portfolios with high-quality, high ROIC companies can also be a highly effective way of running actively managed small-cap portfolios.
FG:
We devote a lot of research on how to best mitigate risk within small-capthat's also important to highlight as a potential benefit of active management. We want to sleep well at night and certainly want our investors to sleep well. So, in our quality portfolios we're looking for what we consider better businesses'that is, companies with little or no debt and established histories of high and consistent ROIC. Our research makes it clear that these kinds of companies tend to be less volatile than most other small-cap stocks while also having the potential to generate market-beating returns over the long run.
How significant a factor are falling rates for the health of the market and/or the economy?
CR:
I think falling rates are less important than the normalization of rates. After the last few years when rates rose at such a breakneck pace, we're now in a period where both the level and rates of change are more in line with long-term historical averages. It's true that the first rate cut provided a boost, but it was short lived, which was not surprising, mostly I think because much of the market had already priced in a reduction. One area that I think will benefit from lower rates going forward, however, is M&A activity. There's been a lot of money on the sidelines as potential buyers were waiting for the Fed to act before moving forward on making acquisitions. And because many small-caps often have the urge to merge,' I think we're likely to see more strategic buys over the next several months.
What impact, if any, do you think the election will have on small-cap stocks?
FG:
This is a question every asset manager is asked during presidential election cycles, so we ran the data and found that small-caps had better returns than large-caps following the last 10 presidential elections. What's interesting is that this has been the case regardless of which party wins the White House or whether or not the president's party also won congressional majorities. It's also held true even though every election cycle has its own set of challenges, difficulties, and opportunities. What this suggests to us is that it's not so much about the person or policies as much as it's about an end to the uncertainty that's tends to pervade the months before any election.
How do you develop areas of interest or themes within small-cap?
CR:
We always start at the bottom. Any themes or overarching ideas almost always originate with a few names that screen well for quality and/or inexpensive valuation. Our rigorous research process then often uncovers competitors or customers that also attract our interest. This probably happens most often when we own a company that sells innovative products or services which then leads us to investigate the ecosystem in which that company operates. But we don't start with a theme. It always begins with the individual company and proceeds from there.
Can you talk about a high quality company in which you have a lot of confidence?
CR:
One high-quality company that's compounded in value over time is SEI Investments (NASDAQ:SEIC).
We've owned it for many years. SEI provides platforms and services for the investment management industry and also has an asset management business. It has approximately $1.2 trillion in combined assets under management and assets under administration while also holding a minority stake in LSV Asset Management. Roughly half of SEI's revenue comes from investment servicing operations and processing and half from investment management. Its clients include financial institutions, asset managers, asset owners, and financial advisors. Outside its asset management expertise, SEI's primary value proposition is managing the operations of asset management so that its clients can focus on front-office responsibilities like security selection and relationship management, which creates sticky customer relationships because SEI's services are embedded into their operations. SEI boasts strong margins andcashfl ows, with three of its four major segments steadily high EBIT (earnings before interest & taxes) margins for more than adecade. We also like its low debt, its 80% equity ratio, and roughly 20% ROIC over the last eight years.
Can you also discuss an attractively cheap small-cap whose long-term prospects you like?
CR:
There's a name that Miles Lewis and his team like: Academy Sports and Outdoors (NASDAQ:ASO), which is the second largest sporting goods retailer in the U.S., with locations predominantly in the Southeast. A turnaround that began prior to Covid then accelerated during Covid, as many of their products were favored by consumers during the social distancing period. Margins and same store sales both expanded during 2020 and into 2021. Like many other companies whose businesses were very strong during Covid, ASO is experiencing a post-Covid hangover that's causing investors to question the sustainability of its margins and its long-term outlook in light of two-plus years of negative same store sales. Miles and his team's research leads them to believe that that the margin improvement is mostly structuraland therefore durablewhile the recent same store sales declines are attributable to a weak consumer spending backdrop, particularly for lower and middle income households, to which ASO has outsized exposure. As a result, this business, which has best in class unit economics and significant unit growth potential in the years to come, is trading for less than 9.0x next year's earnings, and much lower versus the team's estimate of earnings a few years out.
What is your outlook for small-cap stocks?
FG:
Our outlook is cautious but constructive. There is plenty to concerned about: wars in the Ukraine and the Middle East, the dockworkers' strike, and another highly contentious election season. However, there are also significant positives: inflation continues to moderate, the economy is growing, unemployment is low, and rates have normalized. We're also beginning to seethe benefits of reshoring, the CHIPS Act, and various infrastructure projects. In addition, there's a positive reversion to the mean argument for small-cap leadership and strong performance. The Russell 2000 finished 3Q24 down -4.7% since the previous small-cap peak on 11/8/21, even as large-caps continued making new highs into the end of September. And the small-cap index's annualized 3-year return for the period ended 9/30/24 was 1.8%. Historically, small-cap performance has been quite strong following previous periods of low or negative performance. As we show in the chart below, these periods of below average performance were followed by periods of higher-than-average returns.
All performance information reflects past performance, is presented on a total return basis, reflects the reinvestment of distributions, and does not reflect the deduction of taxes a shareholder would pay on fund distributions or the redemption of fund shares. Past performance is no guarantee of future results. Investment return and principal value of an investment will fluctuate, so that shares may be worth more or less than their original cost when redeemed. Current performance may be higher or lower than performance quoted. The market price of the Closed-End Fund's shares will fluctuate, so that shares may be worth more or less than their original cost when sold.
Gross annual operating expenses reflect each Fund's gross total annual operating expenses and include management fees, any 12b-1 distribution and service fees, other expenses, and any applicable acquired fund fees and expenses. Net annual operating expenses reflect the application of contractual fee waivers and/or expense reimbursements. All expense information is reported as of the Fund's most current prospectus. Acquired fund fees and expenses reflect the estimated amount of the fees and expenses incurred indirectly by any applicable Fund through its investments in mutual funds and other investment companies.
Royce & Associates has contractually agreed, without right of termination, to waive fees and/or reimburse operating expenses to the extent necessary to maintain net annual operating expenses (excluding brokerage commissions, taxes, interest, litigation expense, acquired fund fees and expenses, and other expenses not borne in the ordinary course of business) through April 30, 2025 at or below the amounts listed below for the Funds' Classes as follows:
Royce Dividend Value Fund Service Class at or below 1.34%
Royce International Premier Fund (Trades, Portfolio) Service Class at or below 1.44%
Royce Micro-Cap Fund Investment Class at or below 1.24%
Royce Small-Cap Value Fund Service Class at or below 1.49%
Royce Smaller-Companies Growth Fund Service Class at or below 1.49%
This material is not authorized for distribution unless preceded or accompanied by a current prospectus. Please read the prospectus carefully before investing or sending money. The performance data and trends outlined in this article are presented for illustrative purposes only. Past performance is no guarantee of future results. Historical market trends are not necessarily indicative of future market movements. Investments in securities of micro-cap, small-cap, and/or mid-cap companies may involve considerably more risk than investments in securities of larger-cap companies. (Please see "Primary Risks for Fund Investors" in the prospectus.)
Investments in foreign companies may be subject to different risks than investments in securities of U.S. companies, including adverse political, social, economic, or other developments that are unique to a particular country or region.(Please see "Investing in International Securities" in the prospectus.)
Mr. Royce's and Mr. Gannon's thoughts and opinions concerning the stock market are solely their own and, of course, there can be no assurance with regard to future market movements. No assurance can be given that the past performance trends as outlined above will continue in the future.
This article first appeared on GuruFocus.