
Refrigerated truckload market grows more vulnerable as fall harvest nears

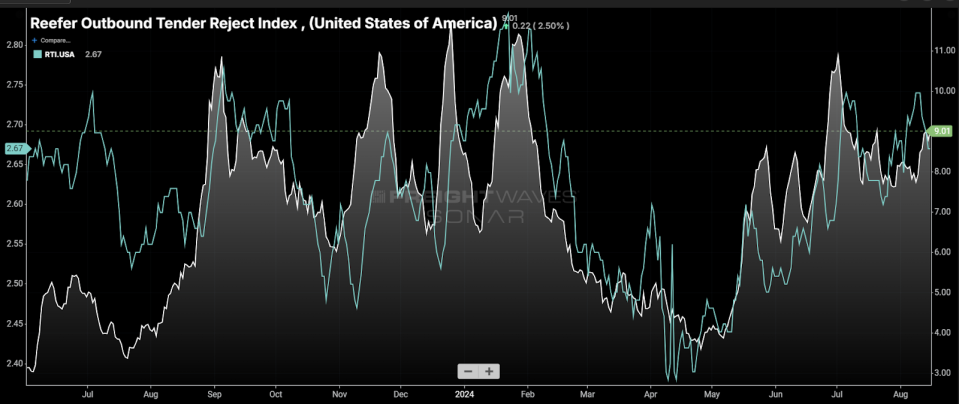
Chart of the Week: Reefer Outbound Tender Reject Index, Reefer Truckload Index – USA SONAR: ROTRI.USA, RTI.USA
The Reefer Outbound Tender Reject Index (ROTRI) and Reefer Truckload Index (RTI), which are both measures of the refrigerated or temperature-controlled truckload market, continue to trend higher heading into a period of seasonal volatility.
The ROTRI, which measures the rate at which carriers turn down loads from shippers, has averaged above 8% since June and maintained at a relatively high level compared to the previous two years. This is also a significant shift from the sub-5% it averaged in the spring.
The RTI, which measures average spot rates for refrigerated loads, has risen about 13% since the end of April. The increasing trend has been relatively stable with a few seasonal spikes around International Roadcheck and the Fourth of July.
At this point last year, the refrigerated rejection rate broke out, spiking above 10% for the first time since the pandemic era. It bounced between 5% and 11% from Labor Day until March. Spot rates moved similarly and erratically. Fall harvests in the Northern tier of the country, especially in the Northwest and Midwestern regions, appeared to be the triggering factors. In January, extreme cold gave the protect-from-freeze season a strong boost.
This may have been a bit of a false start for the sector as this volatile period was followed by what appeared to be a return to a very recessive state, characterized by rejection rates below 5% and the RTI hitting the lowest values since the pandemic ended.
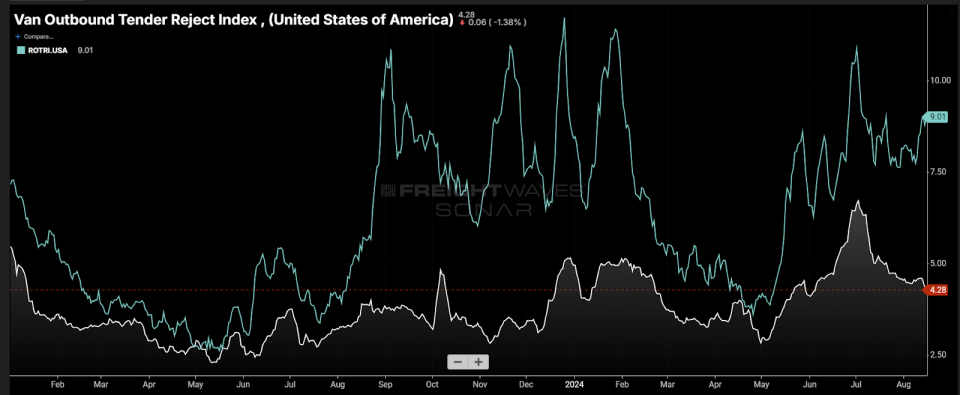
One of the reasons the refrigerated market may have had a secondary recession is that the dry van sector had not yet found its way out of the one it was in. Looking at national dry van rejection rates (VOTRI) last fall, there was some level of increased responsiveness, but the ROTRI was much more reactive.
Reefer tenders represent a much smaller portion of the overall dataset, 13% to 20%, so it naturally will be more volatile and generally average at higher levels, but the further these two diverge the less supported the refrigerated instability will be.
The reason for this is simple fungibility. Dry van carriers can haul some level of temperature-sensitive freight depending on the weather. Also, if there is enough money, dry van operators can hook to a refrigerated trailer or sign on with a carrier. The driver population for refrigerated and dry van capacity is overlapping. This is not as true for some of the other trailer types, such as flatbed.
Van drivers potentially moved into the refrigerated space with the van side remaining relatively subdued. Now that the van sector is showing increasing signs of responsiveness, the recent refrigerated market movement is more significant.
Last year’s volatility was also driven by short-term regionalized seasonal disruptions, while this year appears to be more organic and widespread. Produce seasons tend to get the blame or credit for many of the refrigerated market’s disruptions. The California spring and summer runs can be some of the most disruptive, but this year was relatively muted.
Produce rates out of California have not surpassed spring 2023 peak values, indicating that it was relatively subdued. Lettuce yields suffered due to an unusually wet rainy season out West.
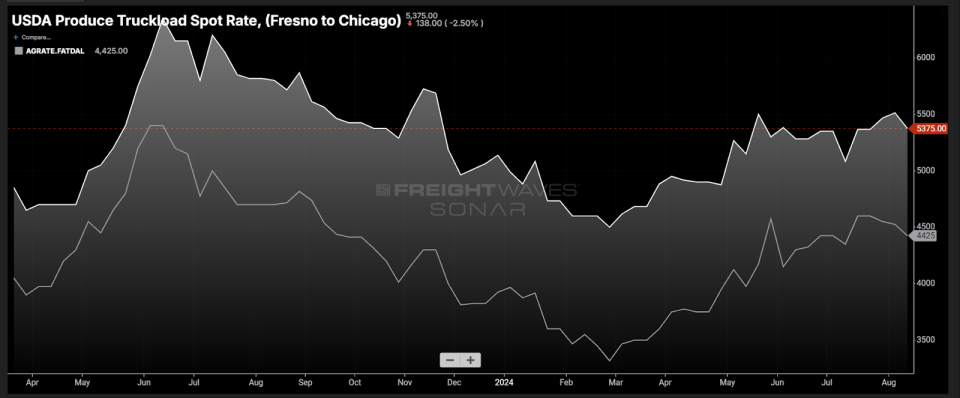
Produce-hauling peak rates from the Central Valley (Fresno) to Chicago are down roughly 13% y/y, a trend that is similar across multiple lanes.
The lack of volatility in produce-hauling rates out of California this summer supports the idea that the refrigerated market has more than seasonal pressure pushing rates higher.
The takeaway is that anyone involved in refrigerated shipping should be more vigilant heading into the fall harvest season.
About the Chart of the Week
The FreightWaves Chart of the Week is a chart selection from SONAR that provides an interesting data point to describe the state of the freight markets. A chart is chosen from thousands of potential charts on SONAR to help participants visualize the freight market in real time. Each week a Market Expert will post a chart, along with commentary, live on the front page. After that, the Chart of the Week will be archived on FreightWaves.com for future reference.
SONAR aggregates data from hundreds of sources, presenting the data in charts and maps and providing commentary on what freight market experts want to know about the industry in real time.
The FreightWaves data science and product teams are releasing new datasets each week and enhancing the client experience.
To request a SONAR demo, click here.
The post Refrigerated truckload market grows more vulnerable as fall harvest nears appeared first on FreightWaves.