
Are a Recession and Bear Market Imminent? A Virtually Flawless Predictive Indicator Weighs In.
Although Wall Street's major stock indexes don't move higher in a straight line, there's been no question that the bulls have been in firm control since the start of 2023.
Over a nearly 20-month stretch, the ageless Dow Jones Industrial Average (DJINDICES: ^DJI), benchmark S&P 500 (SNPINDEX: ^GSPC), and growth-powered Nasdaq Composite (NASDAQINDEX: ^IXIC) have respectively increased in value by 23%, 45%, and 68%, as well as surpassed their previous all-time highs on a multitude of occasions.
However, the party on Wall Street may be coming to a close. Even though investors were able to shrug off a 1,400-point, three-session plunge in the Nasdaq Composite to begin August, one predictive indicator, with a virtually flawless track record dating back to 1959, foreshadows trouble for the U.S. economy, as well as stocks.
This forecasting tool hasn't been wrong in 58 years
Let me preface this discussion by pointing out that there is no such thing as a perfect predictive tool or metric. If there were a metric that could, with 100% accuracy, forecast short-term directional moves for stocks, every single professional and retail investor would be using it.
There are, however, a few economic data points and predictive metrics that have previously correlated very closely with big moves in the stock market's major indexes. It's these tools that investors are leaning on with the hope of gaining an edge in determining what comes next for Wall Street.
Recently, I've examined a number of these metrics and events that strongly correlate with moves lower in the Dow Jones, S&P 500, and Nasdaq Composite and/or portend trouble for the U.S. economy. This includes the first notable decline in U.S. M2 money supply since the Great Depression, one of the priciest S&P 500 Shiller price-to-earnings readings since the early 1870s, as well as the historic performance of stocks following the kickoff to a Federal Reserve rate-easing cycle. The nation's central bank is expected to begin easing rates next month.
But it's the Federal Reserve Bank of New York's recession probability indicator that might be the most damning of them all.
The NY Fed's recession tool measures the likelihood of a U.S. recession taking place over the next 12 months by examining the spread (i.e., difference in yield) between the 10-year Treasury bond and three-month Treasury bill.
When the U.S. economy is strong and investors are optimistic, the Treasury yield curve slopes up and to the right. This is to say that bonds set to mature in 10 or 30 years will have higher yields than Treasury bills that'll mature in a year or less. It's normal to receive a higher yield when your capital is tied up for a longer period of time.
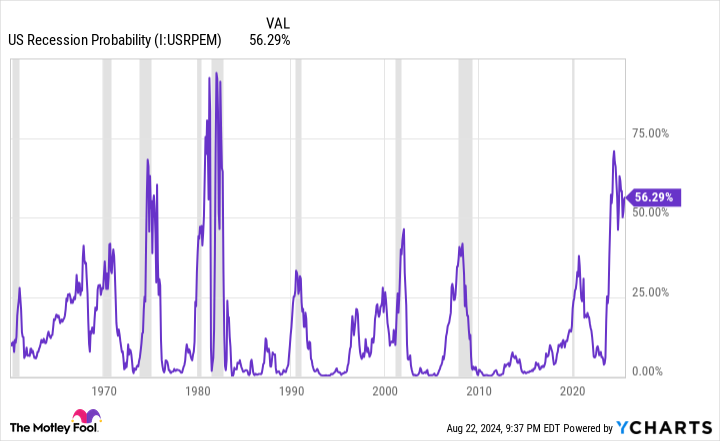
Conversely, when there are concerns about the health of the U.S. economy, we see the yield curve invert, with short-term T-bills sporting higher yields than long-term T-bonds. Although not every yield-curve inversion means a U.S. recession is imminent, every U.S. recession since World War II has been preceded by a yield-curve inversion.
As you can see from the latest monthly update of the NY Fed's recession-forecasting model, which highlights the longest continuous yield-curve inversion in history, there's a 56.29% chance of a U.S. recession taking shape by July 2025.
Since 1959, there's only been one instance (October 1966) where the probability of a U.S. recession surpassed 32% and an official economic contraction, as declared by the National Bureau of Economic Research (NBER), didn't take place. In other words, a recession probability of 32% or greater over the last 58 years has, without fail, signaled a coming recession for the U.S. economy.
Although the economy and stock market aren't tethered at the hip, the overall health of the economy does matter for corporate America. If the U.S. economy weakens and unemployment rises, it's almost a lock to adversely impact corporate earnings.
Data collected and analyzed by Bank of America Global Research finds that approximately two-thirds of the S&P 500's peak-to-trough drawdowns occur after, not prior to, a recession being declared by the NBER. With a key recession ingredient firmly in place, the implication is that stocks could head meaningfully lower -- i.e., into a bear market -- in the foreseeable future.

Patience isn't just a virtue -- it's a necessary ingredient to success on Wall Street
As much as investors might dislike U.S. recessions and stock market corrections/bear markets, they're normal and inevitable aspects of the economic and investing cycle.
But if you take a step back, widen your lens, and allow patience and perspective to be your guides, you'll see that these occasional moments of panic and disappointment serve as opportunities for long-term-minded investors to take advantage of potential price dislocations in time-tested businesses on Wall Street.
The key thing to understand about the economic cycle is that it isn't linear. While recessions may be inevitable, nine of the 12 official downturns since the end of World War II were resolved in under a year. Comparatively, almost every economic expansion has stuck around for multiple years, including two growth spurts that surpassed the decade mark. Betting on the U.S. economy to expand over time has unquestionably been the smarter move, even with the occasional recession sprinkled in.
The nonlinear nature of economic cycles also translates to Wall Street's major stock indexes.
In June 2023, the researchers at Bespoke Investment Group posted a dataset to X (the social media platform formerly known as Twitter) that examined the calendar length of every bear and bull market in the broad-based S&P 500, dating back to the start of the Great Depression in September 1929.
It's official. A new bull market is confirmed.
The S&P 500 is now up 20% from its 10/12/22 closing low. The prior bear market saw the index fall 25.4% over 282 days.
Read more at https://t.co/H4p1RcpfIn. pic.twitter.com/tnRz1wdonp-- Bespoke (@bespokeinvest) June 8, 2023
Over a 94-year stretch, the average length of the 27 recorded S&P 500 bear markets was just 286 calendar days, or about 9.5 months. On the other hand, the typical S&P 500 bull market was 1,011 calendar days long, equating to roughly two years and nine months.
You'll also note that the lengthiest bear market in the S&P 500's history, which occurred between January 1973 and October 1974, is still shorter than 13 out of the 27 S&P 500 bull markets since September 1929.
At the end of the day, we're never going to be able to precisely forecast when a correction or bear market will begin, how long it'll last, or where the ultimate bottom will be. But history does conclusively point to patience and perspective being powerful tools for investors that can help them navigate whatever short-term turbulence or uncertainty Wall Street or the U.S. economy throws their way.
Don’t miss this second chance at a potentially lucrative opportunity
Ever feel like you missed the boat in buying the most successful stocks? Then you’ll want to hear this.
On rare occasions, our expert team of analysts issues a “Double Down” stock recommendation for companies that they think are about to pop. If you’re worried you’ve already missed your chance to invest, now is the best time to buy before it’s too late. And the numbers speak for themselves:
Amazon: if you invested $1,000 when we doubled down in 2010, you’d have $19,939!*
Apple: if you invested $1,000 when we doubled down in 2008, you’d have $42,912!*
Netflix: if you invested $1,000 when we doubled down in 2004, you’d have $370,348!*
Right now, we’re issuing “Double Down” alerts for three incredible companies, and there may not be another chance like this anytime soon.
*Stock Advisor returns as of August 22, 2024
Bank of America is an advertising partner of The Ascent, a Motley Fool company. Sean Williams has positions in Bank of America. The Motley Fool has positions in and recommends Bank of America. The Motley Fool has a disclosure policy.
Are a Recession and Bear Market Imminent? A Virtually Flawless Predictive Indicator Weighs In. was originally published by The Motley Fool