
The S&P 500 Just Had Its Worst July in 10 Years. History Says the Stock Market Will Do This Next.
The S&P 500 (SNPINDEX: ^GSPC) rocketed through roughly three dozen record highs and advanced 14.5% during the first six months of 2024. But a burgeoning rotation from large-cap stocks to small-cap stocks blunted that momentum in July.
As of 11:00 AM ET on July 31, the S&P 500 has advanced 1% in the month. The broad-based index was actually down 0.4% headed into the final trading session, but encouraging financial reports from AMD and Microsoft renewed investor confidence in the artificial intelligence boom.
Even so, the S&P 500 is headed toward its worst July since 2014. Compare its activity in the same month in previous years:
July 2023: 3.1%
July 2022: 9.1%
July 2021: 2.3%
July 2020: 5.5%
July 2019: 1.3%
July 2018: 3.6%
July 2017: 1.9%
July 2016: 3.6%
July 2015: 2%
July 2014: (1.5%)
July has historically been one of the strongest months for the stock market, with the S&P 500 returning a median of 2.7% during the last decade. But August has been characterized by muted gains, and September typically entails a sharp decline. Here's what investors should know.
History says the stock market could decline more than 2% through September
The S&P 500 is widely regarded as the best benchmark for the overall U.S. stock market, so we can examine its past performance to make an educated guess about which direction U.S. stocks might move in the coming months.
Historically, the S&P 500 has lost momentum in August, perhaps because certain investors take profits in anticipation of the "September Effect," a bizarre but very real phenomenon whereby the stock market tends to decline sharply in September.
The chart below shows the median monthly return in the S&P 500 during the last decade.
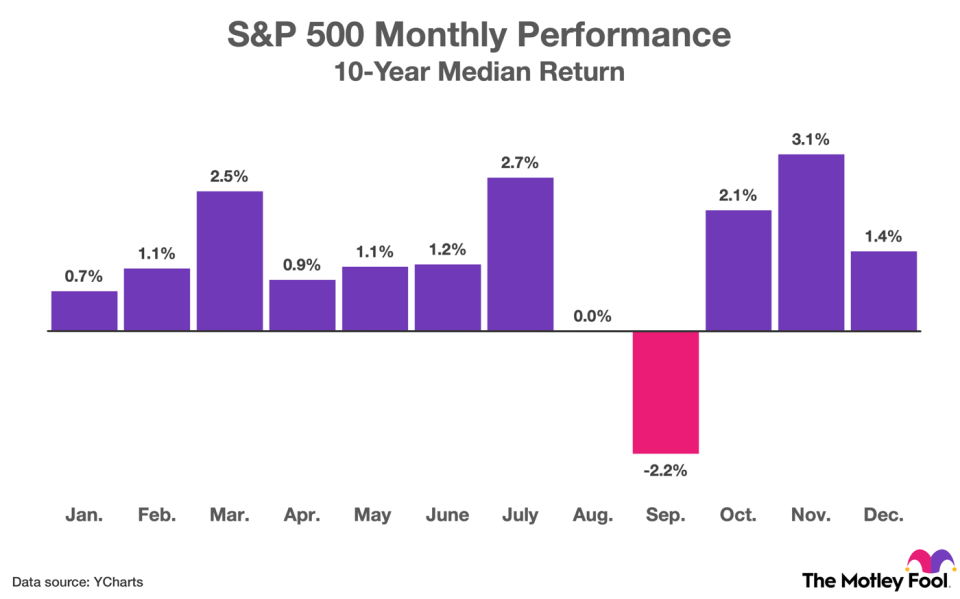
As shown above, the S&P 500 returned a median of 0% in August during the last decade, and the benchmark index declined by a median of 2.2% in September. The outlook is brighter if we extend the time horizon back to 1957, the year the S&P 500 was created. In that case, the index has returned a median of 1.1% in August, and it has declined by a median 0.7% in September.
After reconciling those data points, the implied change in the S&P 500 ranges from 0.4% upside to 2.2% downside during the next two months. However, short-term forecasts are prone to inaccuracy, because sentiment can change quickly and investors tend to overreact to headlines, both good and bad.
That does not mean long-term forecasts are entirely reliable, but the microeconomic and macroeconomic fundamentals that govern equity prices tend to be more predictable when measured in years and decades rather than weeks and months. So investors should focus on long-term capital appreciation rather than short-term gains.
Investors should prioritize long-term capital appreciation over short-term gains
How the stock market performs over time depends in large part on macroeconomic factors like inflation, interest rates, and gross domestic product. Investor sentiment also plays an important role. Specifically, investors value stocks based on revenue and earnings, and financial metrics are heavily influenced by the macroeconomic climate.
Currently, inflation is trending downward. The Federal Reserve is expected to make six 25-basis-point rate cuts by July 2025, according to CME Group's FedWatch tool. Lower rates should stimulate the economy by incentivizing consumer and business spending. In turn, Wall Street analysts expect S&P 500 companies to report an acceleration in revenue and earnings in 2024 and 2025, as detailed below.
2023: S&P 500 companies reported revenue and earnings growth of 2.4% and 0.9%, respectively.
2024: S&P 500 companies are forecasted to grow revenue and earnings 5.1% and 10.9%, respectively.
2025: S&P 500 companies are forecasted to grow revenue and earnings 6% and 14.8%, respectively.
Those forecasts notwithstanding, the S&P 500 still trades at 20.6 times forward earnings, a substantial premium to the 10-year average of 17.9 times forward earnings. That means many stocks are expensive by historical standards, so even the slightest deviation from consensus revenue and earnings estimates could send the S&P 500 into a tailspin.
Analysts at Morgan Stanley and JPMorgan Chase see that as a distinct possibility. They have set the S&P 500 with year-end targets of 4,500 and 4,200, respectively. Those forecasts imply downside of 18% and 24%, respectively, from its current level of 5,515. However, analysts at Oppenheimer and Evercore see the situation differently. They have set the S&P 500 with year-end targets of 5,900 and 6,000, implying upside of 7% and 9%, respectively.
Here's the bottom line: Even experts have wildly different opinions about how the stock market will perform in the remaining months of 2024. So prudent investors think in terms of years and decades, rather than weeks and months. The S&P 500 returned 1,990% over the last 30 years, which is equivalent to 10.66% annually. That period encompasses such a broad range of economic climates that similar returns are likely in future decades.
In other words, many stocks will create substantial wealth in the future, so investors should look vigilantly for buying opportunities regardless of how the S&P 500 performs in August and September.
Should you invest $1,000 in S&P 500 Index right now?
Before you buy stock in S&P 500 Index, consider this:
The Motley Fool Stock Advisor analyst team just identified what they believe are the 10 best stocks for investors to buy now… and S&P 500 Index wasn’t one of them. The 10 stocks that made the cut could produce monster returns in the coming years.
Consider when Nvidia made this list on April 15, 2005... if you invested $1,000 at the time of our recommendation, you’d have $635,614!*
Stock Advisor provides investors with an easy-to-follow blueprint for success, including guidance on building a portfolio, regular updates from analysts, and two new stock picks each month. The Stock Advisor service has more than quadrupled the return of S&P 500 since 2002*.
*Stock Advisor returns as of July 29, 2024
JPMorgan Chase is an advertising partner of The Ascent, a Motley Fool company. Trevor Jennewine has no position in any of the stocks mentioned. The Motley Fool has positions in and recommends Advanced Micro Devices, JPMorgan Chase, and Microsoft. The Motley Fool recommends CME Group and recommends the following options: long January 2026 $395 calls on Microsoft and short January 2026 $405 calls on Microsoft. The Motley Fool has a disclosure policy.
The S&P 500 Just Had Its Worst July in 10 Years. History Says the Stock Market Will Do This Next. was originally published by The Motley Fool