
Narrowing Market Breadth Raises Risk of S&P 500 Pullback

Spencer Platt / Getty Images
Key Takeaways
The S&P 500's advance-decline line, a measure of market breadth, has been in decline since May, even as the index has soared to record highs.
The divergence of the A/D line and the index suggests that the rise of a few large stocks has masked an erosion of sentiment in the broader equities market.
Information Technology was the only sector to have outpaced the S&P 500 in June, as of Thursday's close.
The S&P 500 has set record after record in the past month, but pop the hood and things aren’t looking quite so good.
The advance-decline (A/D) line, a measure of market breadth, has been on its way down since the end of May, even as the S&P 500 has soared to new heights, according to a note from LPL Financial Friday.
The A/D line is calculated by subtracting the number of declining stocks in the S&P 500 from the number of advancing stocks and adding the difference to the prior day’s value. An increasing A/D line indicates strong breadth, while a declining A/D line represents narrowing breadth.
Together, a soaring S&P 500 and declining A/D line, as shown in the chart from LPL Financial below, can be cause for concern on Wall Street. It indicates gains by a handful of large stocks are masking softness among smaller stocks, potentially signaling weakening investor sentiment.
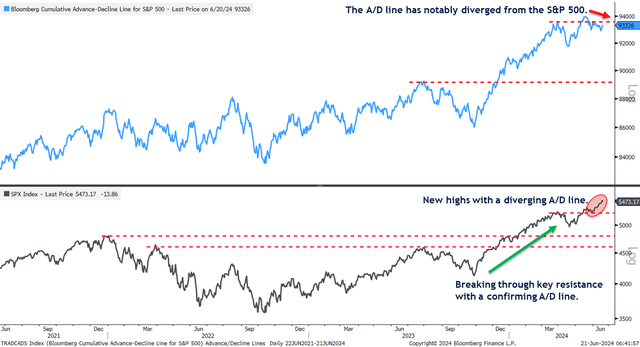
LPL Financial
The divergence also increases the market’s concentration risk because the biggest stocks are increasing their weight in the S&P 500 while laggards are losing weight. A sharp decline in the shares of the index’s largest companies will have an outsized impact on the index as a whole when breadth is minimal.
That dynamic was on full display on Thursday when the S&P 500 fell from a record intraday high as Nvidia (NVDA) slumped 3.5%—its largest one-day decline since late May. That's not a particularly long time, but in that period Nvidia shares rose 22%, boosting its market capitalization from $2.7 trillion to more than $3.3 trillion and increasing its influence over the S&P 500.
$3 Trillion Market Cap Club
To be sure, Nvidia isn't the only stock that's contributed to the divergence. The other members of the $3 trillion club, Microsoft (MSFT) and Apple (AAPL), also have surged to all-time highs in recent weeks. They have been joined by a cadre of smaller mega caps, including Broadcom (AVGO), Oracle (ORCL), and Adobe (ADBE), which have been buoyed by earnings reports that demonstrated strong demand for their artificial intelligence (AI) offerings.
Meanwhile, the rest of the market has languished. As of Thursday’s close, Information Technology (+10.7%) was the only sector to have outperformed the S&P 500 (+3.7%) so far this month. The only sectors within 1 percentage point of the broader index were Consumer Discretionary (+3.3%) and Communication Services (+2.7%), sectors dominated by AI giants Amazon (AMZN), Alphabet (GOOGL), and Meta Platforms (META).
The A/D line divergence noted earlier does not, LPL Financial’s Chief Technical Strategist Adam Turnquist points out, mean the bull market is over, “but it does point to elevated risk the broader market could be due for a potential pause or pullback.”
Read the original article on Investopedia.